


Oil Price Talking Points
The price of oil appears to be stuck within the opening range for May amid the failed attempt to test the March high ($67.98), and looming developments in the Relative Strength Index (RSI) may warn of a larger correction in crude as the indicator appears to be threatening the upward trend from earlier this year.
Oil Price Stuck in May Opening Range After Failing to Test March High
The price of oil seems to be unfazed by the less-than-expected contraction in US inventories as the Colonial Pipeline on the East Coast comes back online, and signs of greater supply may undermine the recent rally in crude as the Organization of the Petroleum Exporting Countries (OPEC) remain on track to gradually restore production over the coming months.
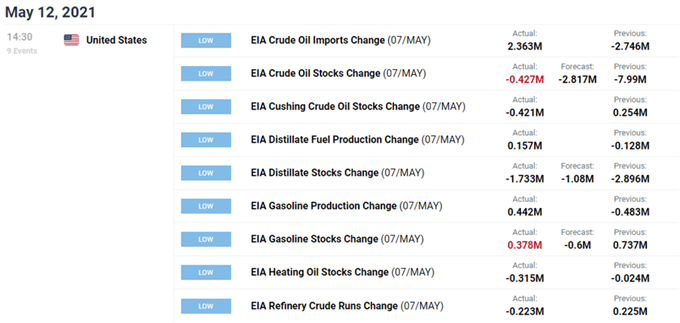
Fresh figures from the US Energy Information Administration (EIA) showed crude stockpiles narrowing 0.427M in the week ending May 7 versus forecasts for a 2.817M decline, and further indications of slowing demand may push OPEC and its allies to regulate the energy market throughout 2021 as the group warns that the resurgence of COVID-19 “could hamper the economic and oil demand recovery.”
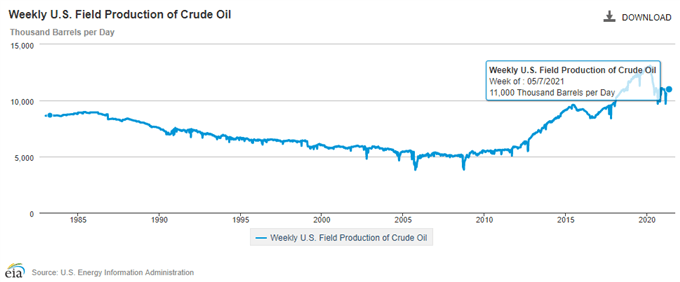
A deeper look at the EIA report weekly field production climbing to 11,000K from 10,900K in the week ending April 30, and it remains to be seen if OPEC and its allies will respond to the tepid recovery in US production as the group appears to be on track to retain the production adjustments table at the next Joint Ministerial Monitoring Committee (JMMC) meeting on June 1.
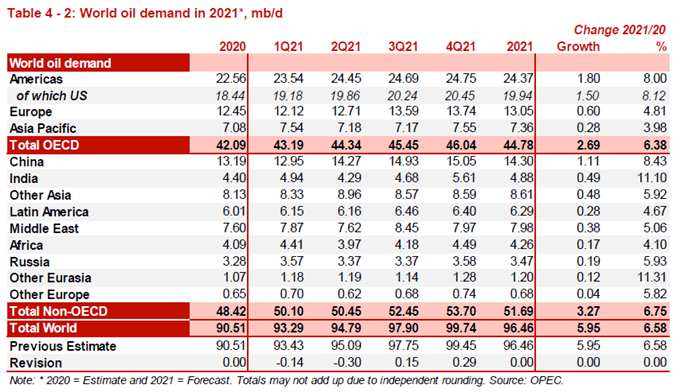
Nevertheless, OPEC’s most recent Monthly Oil Market Report (MOMR) states that “for 2021, world oil demand is expected to increase by 6.0 mb/d, unchanged from last month’s estimate, to average 96.5 mb/d,” with the update going onto say that “slower than anticipated demand in OECD Americas during 1Q21, together with theresurgence of COVID-19 cases in India and Brazil, caused the 1H21 oil demand data to be revised downwards.”
With that said, the price of oil may face headwinds ahead of the next OPEC+ meeting as the group stays on track to gradually restore production, and looming developments in the Relative Strength Index (RSI) may warn of a larger correction in crude as the indicator appears to be threatening the upward trend from earlier this year.
Oil Price Daily Chart
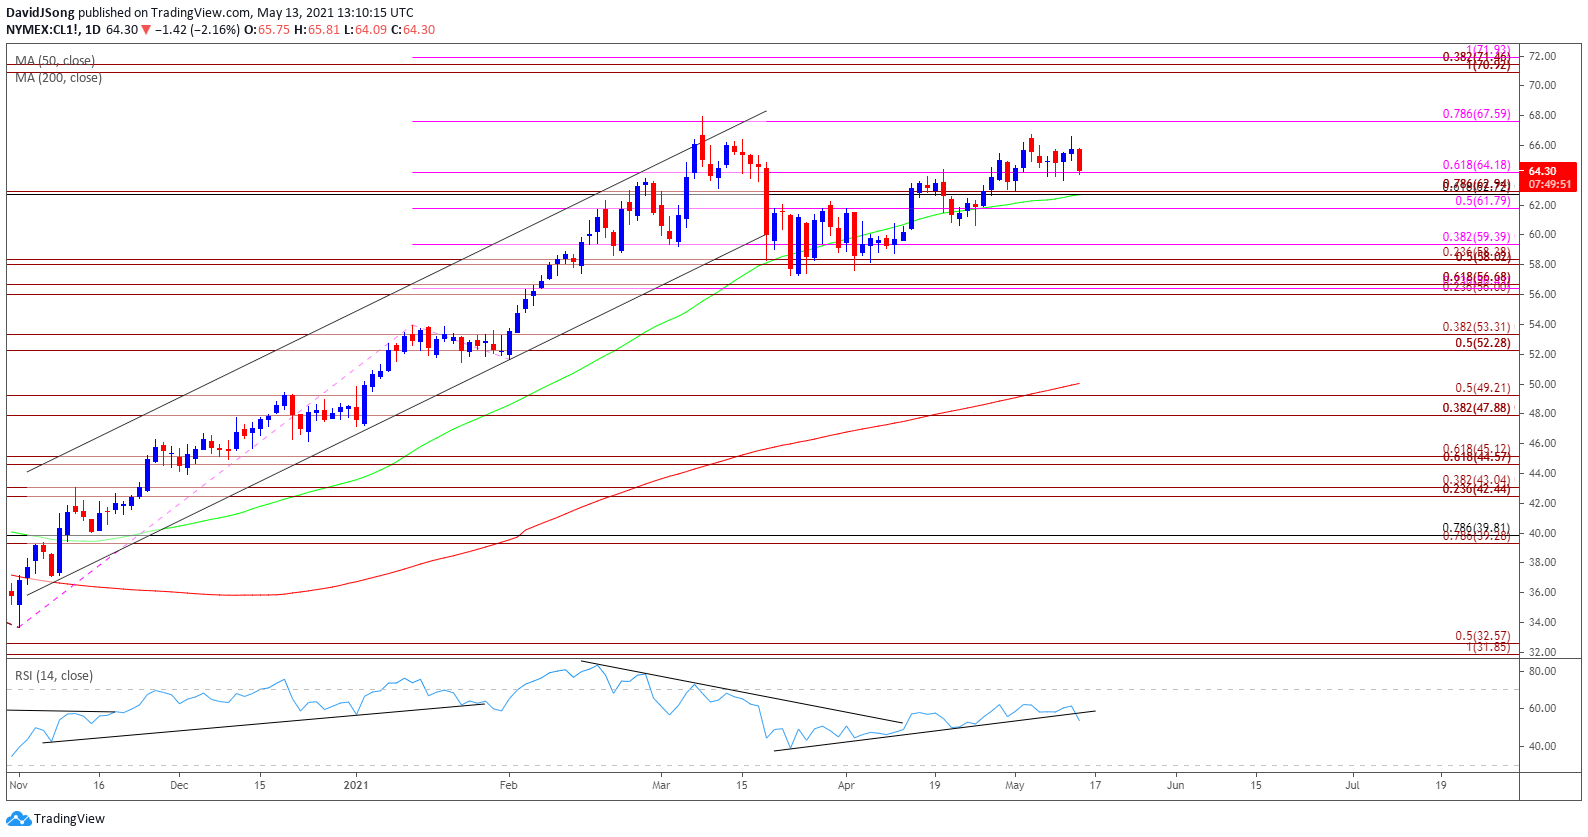
Source: Trading View
- Keep in mind, crude broke out of the range bound price action from the third quarter of 2020 as it established an upward trending channel, with the price of oil taking out the 2019 high ($66.60) as both the 50-Day SMA ($62.70) and 200-Day SMA ($50.04) still reflect a positive slope.
- It remains to be seen if the decline from the March high ($67.98) will turn out to be a correction in the broader trend or a change in market behavior as the price of oil fails to retain the upward trending channel from late last year, and looming developments in the Relative Strength Index (RSI) may show the bullish momentum abating as it threatens the upward trend established in March.
- The failed attempt to test the $67.60 (78.6% expansion) region has pushed the price of oil back towards the $64.20 (61.8% expansion) region, with the next area of interest coming in around $62.70 (61.8% retracement) to $62.90 (78.6% expansion), which largely lines up with the 50-Day SMA ($62.70).
- Failure to retain the monthly opening range may bring the $61.80 (50% expansion) area on the radar, with the next area of interest coming in around $59.40 (38.2% expansion).

--- Written by David Song, Currency Strategist
Follow me on Twitter at @DavidJSong


