


Japanese Yen Talking Points
The recent advance in USD/JPY appears to be stalling as it struggles to extend the series of higher highs and lows following the Federal Reserve interest rate decision, but the recent recovery in the exchange rate removes the threat of a head-and-shoulders formation as it breaks above the left shoulder.
USD/JPY Rate Recovery Removes Threat of Head-and-Shoulders Formation
USD/JPY trades within a narrow range to largely mimic the consolidation in longer-dated US Treasury yields, and it remains to be seen if the exchange rate will preserve the advance following the Fed rate decision as the central bank continues to endorse a dovish forward guidance for monetary policy.
In a recent speech, New York Fed President John Williamswarns that “we still have a long way to go to achieve a robust and full economic recovery,” with the permanent voting-member on the Federal Open Market Committee (FOMC) going onto say that the “robust economic growth this year by itself isn't enough to achieve the truly strong and full economic recovery that we are aiming for.”
As a result, Williams emphasizes that “it's important not to overreact to this volatility in prices resulting from the unique circumstances of the pandemic,” and it seems as though the Fed is in no rush to scale back its emergency measures as “the data and conditions we are seeing now are not nearly enough for the FOMC to shift its monetary policy stance.”
The comments suggests the Fed will stick to a wait-and-see approach as the central bank warns of a transitory rise in inflation, and it remains to be seen if the FOMC will adjust the forward guidance at its next interest rate decision on June 16 as Fed officials are slated to update the Summary of Economic Projections (SEP).
Until then, USD/JPY may continue to track the swings in longer-dated US yields even though the FOMC stays on track to “increase our holdings of Treasury securities by at least $80 billion per month and of agency mortgage-backed securities by at least $40 billion per month,” but the recent appreciation in the exchange rate may continue to coincide with the renewed in retail sentiment as the crowding behavior from 2020 resurfaces.
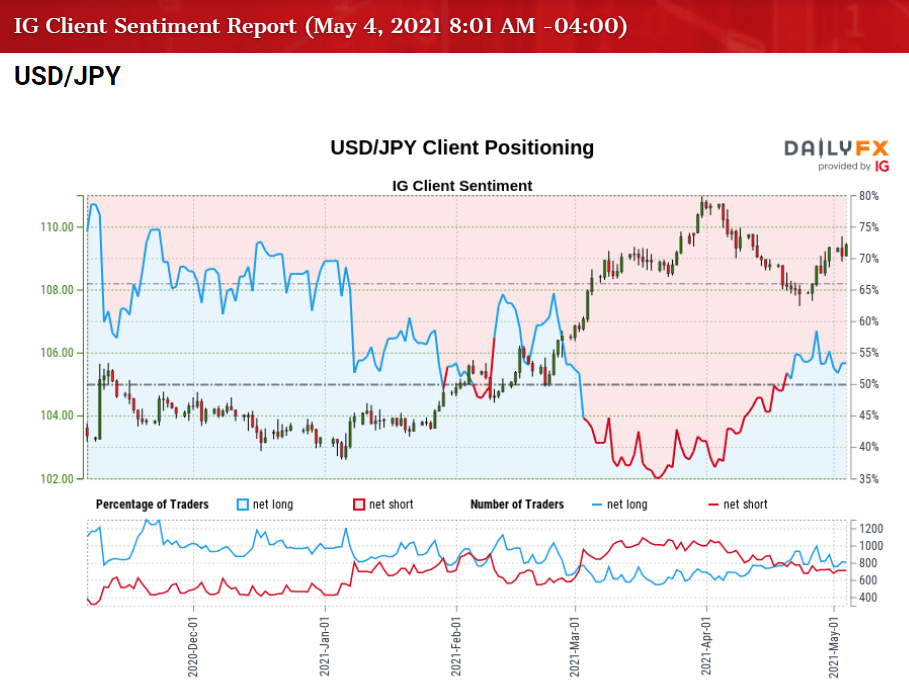
The IG Client Sentiment report shows 55.17% of traders are currently net-long USD/JPY, with the ratio of traders long to short standing at 1.23 to 1.
The number of traders net-long is 13.47% higher than yesterday and 12.65% lower from last week, while the number of traders net-short is 5.52% higher than yesterday and 3.47% higher from last week. The decline in net-long position has eased the tilt in retail sentiment as 59.73% of traders were net-long USD/JPY last week, while the rise in net-short interest comes as the exchange rate struggles to extend the series of higher highs and lows following the Fed rate decision.
With that said, the decline from the March high (110.97) may turn out to be a correction rather than a change in trend as the crowding behavior from 2020 resurfaces, and the recent recovery in the exchange rate removes the threat of a head-and-shoulders formation as it breaks above the left shoulder.

USD/JPY Rate Daily Chart
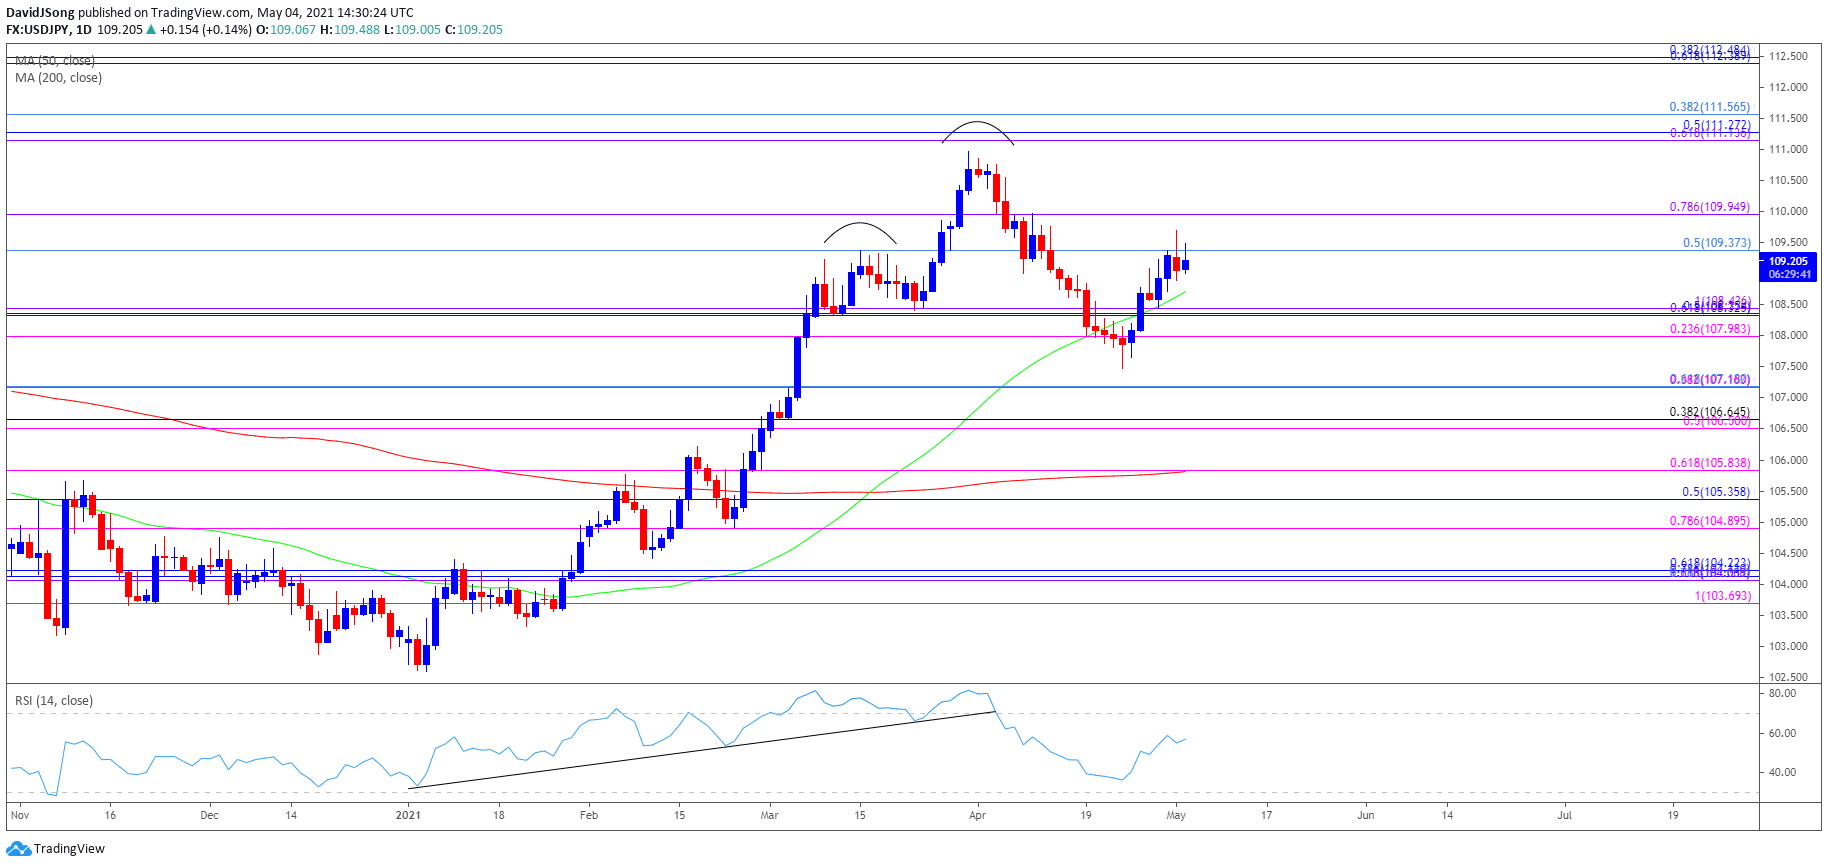
Source: Trading View
- USD/JPY approached pre-pandemic levels as a ‘golden cross’ materialized in March, with a bull flag formation unfolding during the same period as the exchange rate traded to a fresh yearly high (110.97).
- The Relative Strength Index (RSI) showed a similar dynamic as the indicator climbed above 70 for the first time since February 2020, but the pullback from overbought territory has negated the upward trend from this year, with USD/JPY dipping below the 50-Day SMA (108.71) for the first time since January.
- Nevertheless, USD/JPY appears to have reversed course ahead of the March low (106.37) as it trades back above the 50-Day SMA (108.71), but need a break/close above the Fibonacci overlap around 109.40 (50% retracement) to 110.00 (78.6% expansion) to open up the March high (110.97).
- A break above the March high (110.97) opens up the overlap around 111.10 (61.8% expansion) to 111.60 (38.2% retracement), with the next area of interest coming in around 112.40 (61.8% retracement) to 112.50 (38.2% retracement).

--- Written by David Song, Currency Strategist
Follow me on Twitter at @DavidJSong


