


Gold Price Talking Points
The price of gold appears to be stuck in a narrow range following the failed attempt to test the March high ($1760), but the precious metal may continue to exhibit the bearish price action from earlier this year as former support appears to be acting as resistance.
Gold Price Tracks Trendline Resistance to Keep Bearish Trend Intact
The price of gold attempts to retrace the decline from the start of the week as the 10-Year US Treasury yield pulls back from the yearly high (1.75%), and a further decline in longer-dated Treasury yields may keep the precious metal afloat as the Federal Reserve appears to be on track to retain the current course for monetary policy.
A recent speech by Fed Governor Lael Brainard suggests the Federal Open Market Committee (FOMC) is in no rush to switch gears as “the K-shaped labor market recovery remains uneven across racial groups, industries, and wage levels,” and it seems as though the central bank will continue to utilize its emergency tools as “the speed of further improvement in the labor market following the initial rush of reopening is less clear.”
As a result, Brainard warns that “it also seems likely that a surge of demand may be met by some transitory supply bottlenecks amid a rapid reopening of the economy, leading PCE (Personal Consumption Expenditures) inflation to rise somewhat above 2 percent on a transitory basis by the end of 2021,” with the official going onto say that “the current approach calls for patience, enabling the labor market to continue to improve and inflation expectations to become re-anchored at 2 percent.”
It remains to be seen if the FOMC will adjust the forward guidance later this year as Brainard insists that “the expected improvements in the outlook reflect progress on controlling the virus, nearly $3 trillion in additional fiscal support, and forceful and timely support from monetary policy,” and it seems as though Chairman Jerome Powell and Co. will stick to the same script at the next interest rate decision on April 28 as the central bank carries out an outcome based approach for monetary policy.
Until then, key market themes may sway the price of gold as longer-dated US Treasury yields return to pre-pandemic levels, and the decline from the record high ($2075) may continue to indicate a change in trend as a ‘death cross’ formation takes shape in 2021.
With that said, the rebound from the March low ($1677) may unravel as former support appears to be acting as resistance, and the price of gold may attempt to test the June 2020 low ($1671) as it appears to be tracking the downward trend from earlier this year.
Gold Price Daily Chart
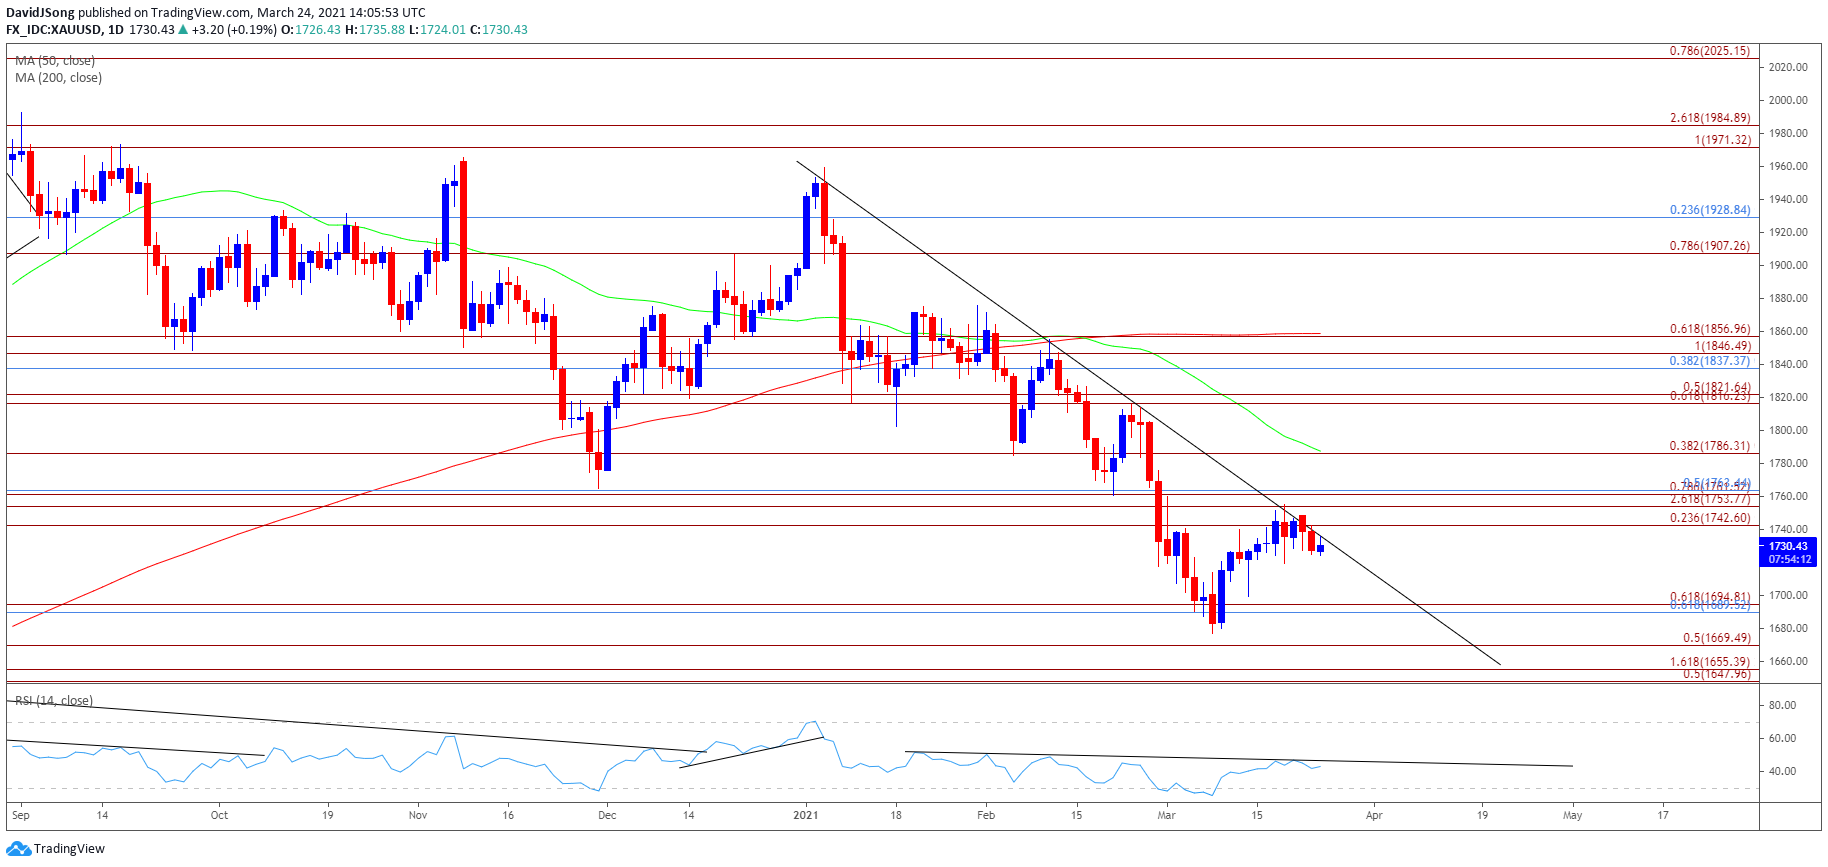
Source: Trading View
- Keep in mind, the price of gold pushed to fresh yearly highs throughout the first half 2020, with the bullish price action also taking shape in August as the precious metal tagged a new record high ($2075).
- However, the bullish behavior failed to materialize in September as the price of gold traded below the 50-Day SMA ($1788) for the first time since June, with developments in the Relative Strength Index (RSI) negating the wedge/triangle formation established in August as the oscillator slipped to its lowest level since March.
- The RSI dipped into oversold territory in November for the first time since 2018, with thedecline from the record high ($2075) indicating a potential shift in market behavior as the price of gold cleared the November low ($1765).
- It seems as though oversold readings in the RSI could be a reoccurring theme in 2021 as the oscillator still tracks the downward trend established earlier this year, with the price of gold highlighting a similar dynamic as it appears to be reacting to trendline resistance.
- At the same time, the former support zone around $1743 (23.6% expansion) to $1763 (50% retracement) now appears to be acting as resistance amid the string of failed attempts to test the March high ($1760), and the price of gold may continue to give back the rebound from the monthly low ($1677) as the 50-Day SMA ($1788) displays a negative slope.
- Need a break/close the $1690 (61.8% retracement) to $1695 (61.8% expansion) zone to bring the $1670 (50% expansion) region on radar, with the next area of interest coming in around $1648 (50% expansion) to $1655 (161.8% expansion).

--- Written by David Song, Currency Strategist
Follow me on Twitter at @DavidJSong


