


Gold Price Talking Points
The V-shape recovery in the price of gold appears to have stalled ahead of the Federal Reserve’s last meeting for 2020 amid the failed attempt to test the 50-Day SMA ($1875), and it remains to be seen if the fresh forecasts from Fed officials will influence the precious metal as bullion appears to be moving to the beat of its own drum.
Gold Price Rebound Unravels Ahead of Fed’s Last Meeting for 2020
The rebound from the November low ($1765) unravels, with the price of gold slipping back below the former support zone around $1847 (100% expansion) to $1857 (61.8% expansion), which incorporates the August ($1863) and September low ($1849), and bullion may face headwinds throughout the remainder of the month as major central banks take additional take additional steps to foster a stronger recovery.
The European Central Bank’s (ECB) decision to expand the pandemic emergency purchase programme (PEPP) by EUR 500B to EUR 1.850 trillion may put pressure on the Federal Open Market Committee (FOMC) to provide additional monetary stimulus on December 16 amid the threat of a protracted recovery, and the Fed may take a similar approach as Chairman Jerome Powell and Co. “assess how our ongoing asset purchases can best support our maximum employment and price-stability objectives as well as market functioning and financial stability.”
In turn, key market trends may persist throughout the remainder of the year as the Greenback continues to show an inverse relationship with investor confidence, and the tilt in retail sentiment looks poised to persist as the net-long US Dollar bias from earlier this year resurfaces.

The IG Client Sentiment report shows traders are net-long USD/CHF, USD/CAD and USD/JPY, while the crowd is net-short GBP/USD, EUR/USD, AUD/USD and NZD/USD even though the US Dollar Index has plummeted more than 4% off the September highs.
Nevertheless, the price of gold may continue to move to the beat of its own drum as it no longer traders to fresh yearly highs during every single month in 2020, and the low interest rate environment along with the ballooning central bank balance sheets may no longer provide a backstop for gold as monetary authorities continue to combat the economic shock from COVID-19.
With that said, decline from the record high ($2075) looks to be a shift in market behavior rather than an exhaustion in the bullish trend as the rebound from the November low ($1765) appears to have stalled ahead of the 50-Day SMA ($1875), and the Relative Strength Index (RSI) indicates a similar dynamic as the oscillator continues to track the downward trend established earlier this year.

Gold Price Daily Chart
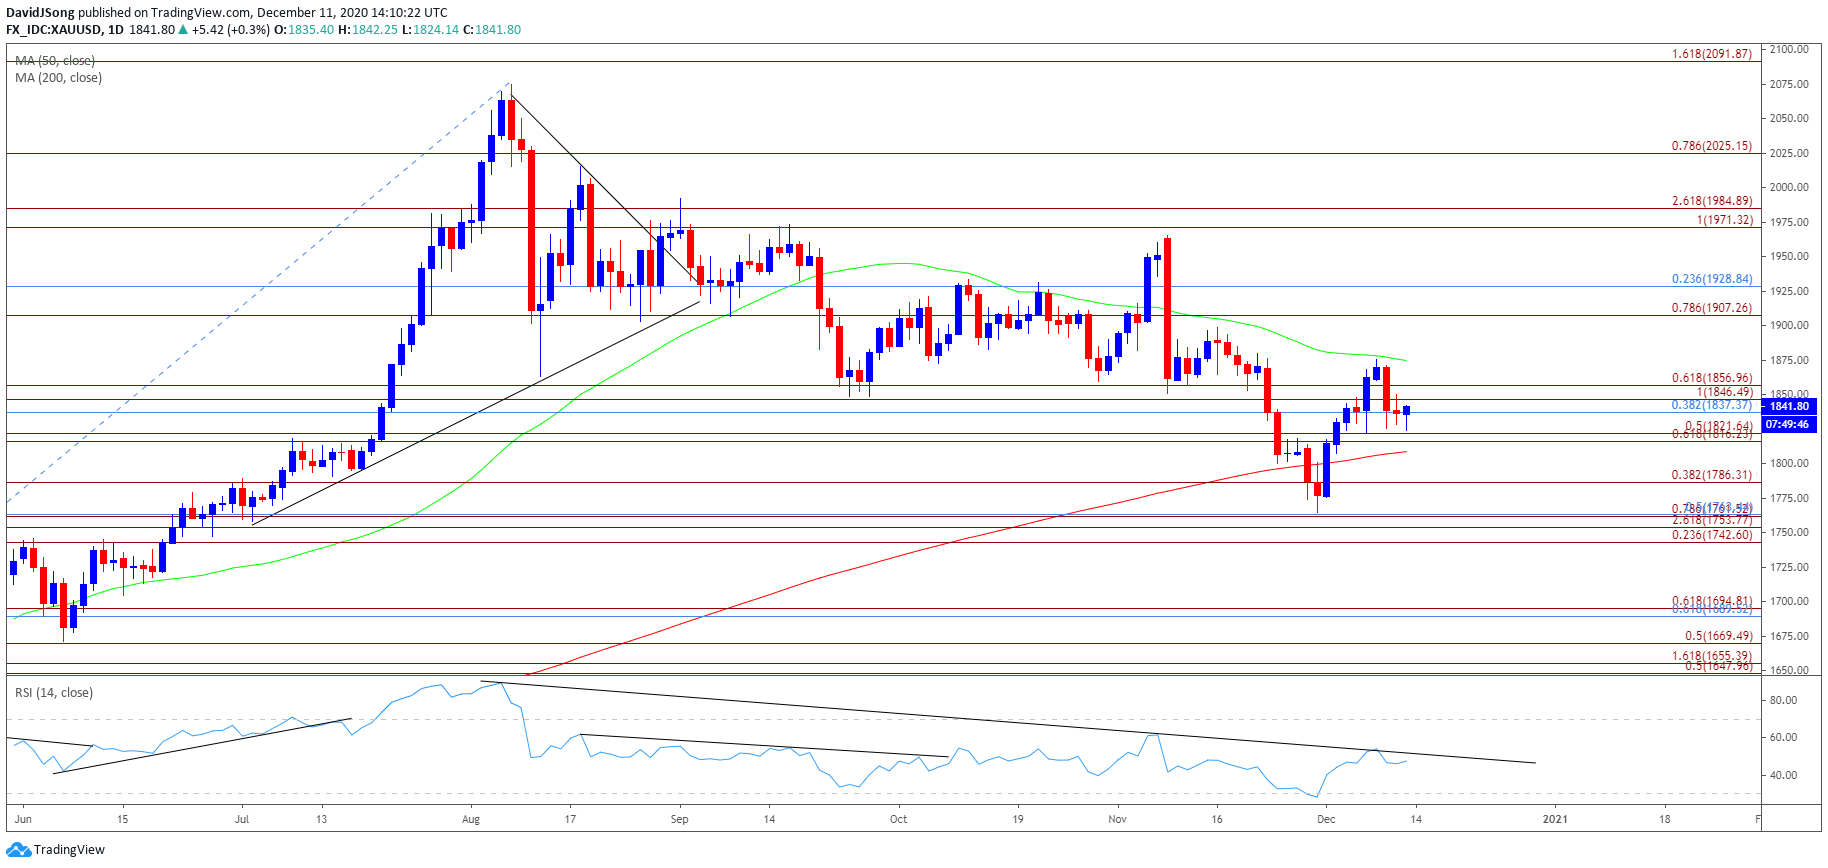
Source: Trading View
- The price of gold pushed to fresh yearly highs throughout the first half 2020, with the bullish price action also taking shape in August as the precious metal tagged a new record high ($2075).
- However, the bullish behavior failed to materialize in September as the price of gold traded below the 50-Day SMA ($1875) for the first time since June, with developments in the Relative Strength Index (RSI) negating the wedge/triangle formation established in August as the oscillator slipped to its lowest level since March.
- The correction from the record high ($2075) now indicates a potential shift in market behavior rather than an exhaustion in the bullish trend as the price of gold trades at its lowest level since July, with the RSI highlighting a similar dynamic as it dipped into oversold territory for the first time since 2018.
- The V-shape recovery emerged following the failed attempt to test the July low ($1758), but the rebound from the November low ($1765) appears to have stalled ahead of the 50-Day SMA ($1875), with the price of gold slipping back below the former support zone around $1847 (100% expansion) to $1857 (61.8% expansion), which incorporates the August ($1863) and September low ($1849).
- Lack of momentum to hold above the $1816 (61.8% expansion) to $1822 (50% expansion) area may open up $1786 (38.2% expansion), with the next region of interest coming in around $1754 (261.8% expansion) to $1764 (50% retracement).

--- Written by David Song, Currency Strategist
Follow me on Twitter at @DavidJSong


