


Gold Price Talking Points
The rebound in the price of gold appears to have stalled ahead of the 50-Day SMA ($1878) as it pulls back from a fresh monthly high ($1875), and the precious metal may continue to move to the beat of its own drum as the low interest rate environment along with the ballooning central bank balance sheets no longer provide a backstop for bullion.
Gold Price Outlook Mired by Failed Attempt to Test 50-Day SMA
The price of gold has staged a V-shape recover following the failed attempt to test the July low ($1758), with the rebound from the November low ($1765) pushing the precious metal back above the former support zone around $1847 (100% expansion) to $1857 (61.8% expansion), which incorporates the August ($1863) and September low ($1849).
However, bullion may continue to move to the beat of its own drum as the price of gold no longer traders to fresh yearly highs during every single month in 2020, and the decline from the record high ($2075) looks to be a shift in market behavior rather than an exhaustion in the bullish trend even though the US Dollar continues to reflect an inverse relationship with investor confidence.
It remains to be seen if the Federal Reserve interest rate decision on December 16 will influence gold prices as Chairman Jerome Powell and Co. “assess how our ongoing asset purchases can best support our maximum employment and price-stability objectives as well as market functioning and financial stability,” and the central bank may utilize the Summary of Economic Projections (SEP) to underscore a dovish forward guidance for monetary policy as Dallas Fed President Robert Kaplan, a 2020-voting member on the Federal Open Market Committee (FOMC), warns that the economic recovery could “stall out either by the end of this year or into the first quarter.”
Until then, swings in risk sentiment may continue sway financial markets as the FOMC vows to “increase its holdings of Treasury securities and agency mortgage-backed securities at least at the current pace,” and the tilt in retail sentiment may carry into 2021 as the net-long US Dollar bias from earlier this year resurfaces.
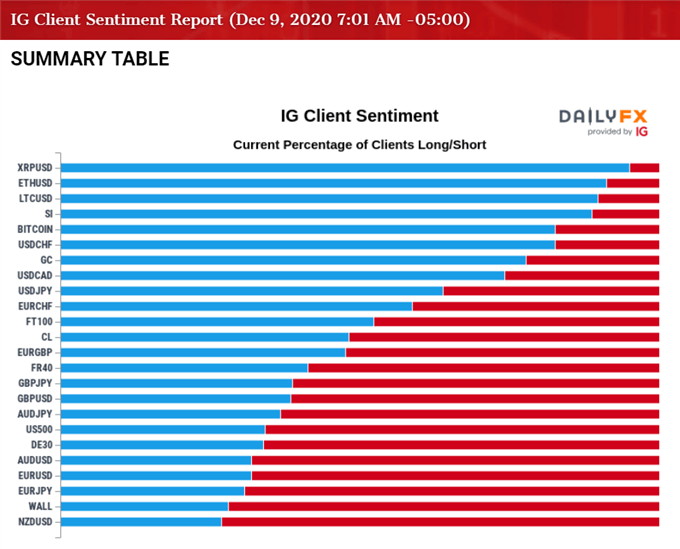
The IG Client Sentiment report shows traders are net-long USD/CHF, USD/CAD and USD/JPY, while the crowd is net-short GBP/USD, AUD/USD, EUR/USD and NZD/USD even though the US Dollar Index has plummeted more than 4% off the September highs.
Looking ahead, it seems as though the Greenback will continue to reflect an inverse relationship with investor confidence as the FOMC relies on its unconventional tools to support the US economy, but the low interest rate environment along with the ballooning central bank balance sheets may no longer provide a backstop for gold as the decline from the record high ($2075) looks to be a shift in market behavior rather than an exhaustion in the bullish trend.
With that said, the price of gold may continue to move to the beat of its own drum as the November low ($1765) appears to be stalling ahead of the 50-Day SMA ($1878), and the pullback from the monthly high ($1875) may gather pace as the Relative Strength Index (RSI) appears to be tracking the downward trend established earlier this year.

Gold Price Daily Chart

Source: Trading View
- The price of gold pushed to fresh yearly highs throughout the first half 2020, with the bullish price action also taking shape in August as the precious metal tagged a new record high ($2075).
- However, the bullish behavior failed to materialize in September as the price of gold traded below the 50-Day SMA ($1878) for the first time since June, with developments in the Relative Strength Index (RSI) negating the wedge/triangle formation established in August as the oscillator slipped to its lowest level since March.
- The correction from the record high ($2075) now indicates a potential shift in market behavior rather than an exhaustion in the bullish trend as the price of gold trades at its lowest level since July, with the RSI highlighting a similar dynamic as it dips into oversold territory for the first time since 2018.
- However, price of gold appears to have reversed course ahead of the July low ($1758) amid the failed attempt to test the $1754 (261.8% expansion) to $1762 (78.6% expansion) region, with the RSI reflecting a textbook buy signal as the indicator quickly crosses back above 30 and recovers from oversold territory.
- The monthly opening range for December raised the scope for higher gold prices as the precious metal extended the series of higher highs and lows from the start of the week, with the break/close above the former support zone around $1847 (100% expansion) to $1857 (61.8% expansion) bringing the Fibonacci overlap around $1907 (78.6% expansion) to $1920 (161.8% expansion) back on the radar.
- Nevertheless, the rebound from the November low ($1765) appears to have stalled ahead of the 50-Day SMA ($1878), with lack of momentum to hold above the $1847 (100% expansion) to $1857 (61.8% expansion) region bringing the $1816 (61.8% expansion) to $1822 (50% expansion) area back on the radar.

--- Written by David Song, Currency Strategist
Follow me on Twitter at @DavidJSong


