


Gold Price Talking Points
The price of gold struggles to retain the rebound from the monthly low ($1851) even though the US Dollar remains on under pressure following the US election, and the precious metal appears to be moving to the beat of its own drum as it tracks the September range.
Gold Prices to Watch as September Range Remains Intact
The price of gold failed to test the September low ($1849) earlier this month despite marking the largest single-day decline since August 11, and bullion may trade within a defined range ahead of the Federal Reserve’s last meeting for 2020 as the central bank is scheduled update the Summary of Economic Projections (SEP).
The fresh forecasts from Fed officials may offer a more detailed forward guidance as the central bank plans to “add two new graphs that show how the balance of participants’ assessments of uncertainty and risks have evolved over time,” and the Federal Open Market Committee (FOMC) may keep the door open to further support the US economy as Chairman Jerome Powell and Co. pledge to “monitor developments and assess how our ongoing asset purchases can best support our maximum employment and price stability objectives, as well as market functioning and financial stability.”
Recent actions taken by other central banks may put pressure on the FOMC to do more as the Reserve Bank of Australia (RBA) and the Reserve Bank of New Zealand (RBNZ) deploy more non-standard measures ahead of 2021, but it seems as though the Fed will rely on its current tools to support the US economy as Chairman Powell and Co. show a greater willingness to extend its lending facilities beyond the current deadline and vow to “increase its holdings of Treasury securities and agency mortgage-backed securities at least at the current pace.”
In turn, key market trends may persist throughout the remainder of the year as the US Dollar broadly reflects an inverse relationship with investor confidence, and the low interest environment along with the ballooning central bank balance sheets may continue to provide a backstop for gold prices as the unconventional policies heighten the appeal of the precious metal as an alternative to fiat-currencies.
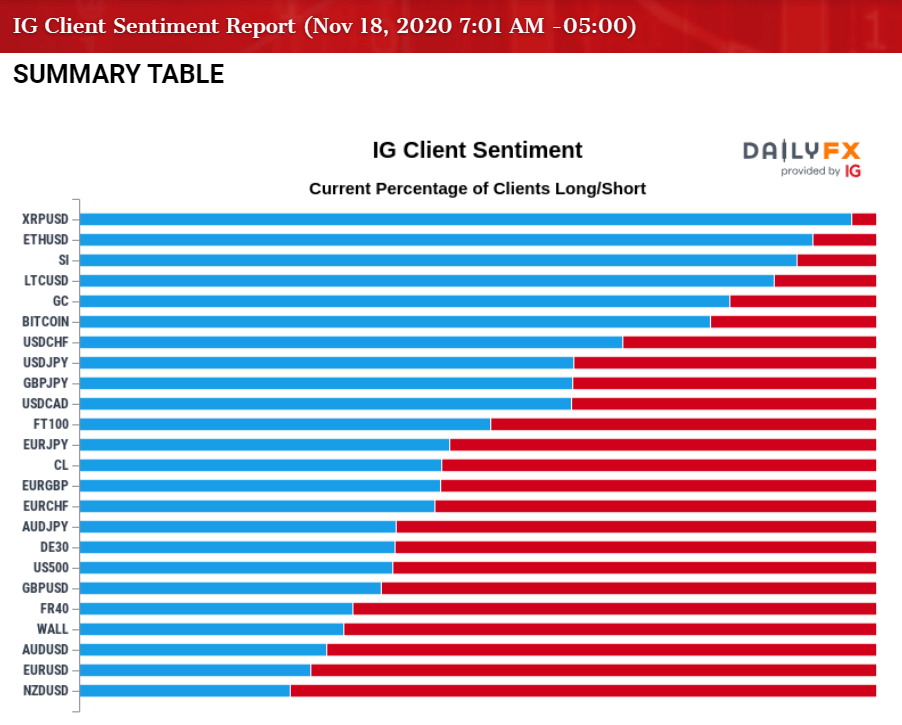
At the same time, the net-long US Dollar bias from earlier this year has resurfaced in November as the IG Client Sentiment report shows retail traders net-long USD/CHF, USD/JPY and USD/CAD, while the crowd is net-short GBP/USD, AUD/USD, EURUSD and NZD/USD.
The crowding behavior in the US Dollar has taken shape even though the Fed’s balance sheet approaches a record high, and it remains to be seen if the correction from the record high ($2075) will turn out to be a change in market behavior or an exhaustion in the bullish trend as the price of gold no longer traders to fresh yearly highs during every single month in 2020.
With that said, the price of gold may trade in a defined range ahead of the FOMC interest rate decision on December 16 as bullion appears to be moving to the beat of its own drum, and the precious metal may stage another failed attempt to test the September low ($1849)

Gold Price Daily Chart
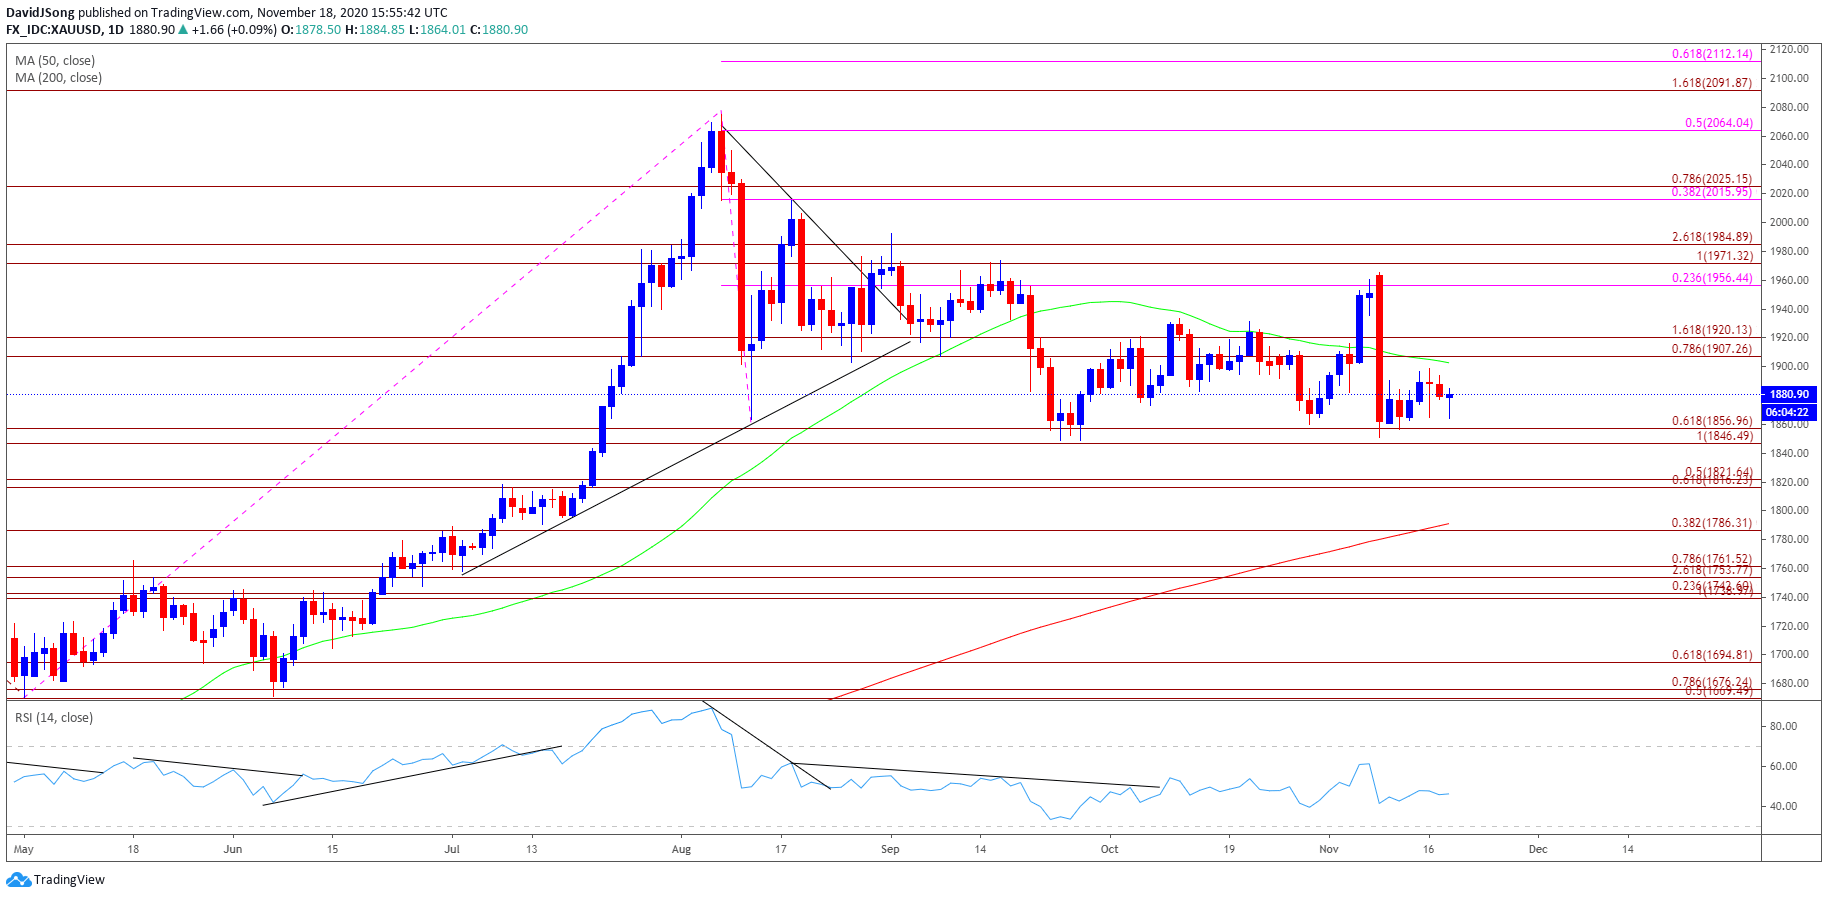
Source: Trading View
- The price of gold pushed to fresh yearly highs throughout the first half 2020, with the bullish price action also taking shape in August as the precious metal tagged a new record high ($2075).
- However, the bullish behavior failed to materialize in September as the price of gold traded below the 50-Day SMA ($1903) for the first time since June, with developments in the Relative Strength Index (RSI) negating the wedge/triangle formation established in August as the oscillator slipped to its lowest level since March.
- Nevertheless, the decline from the record high ($2075) may turn out to be an exhaustion in the bullish trend rather than a change in market behavior as the RSI breaks out of the downward trend carried over from August and recovers from its lowest readings since March.
- As a result, the price of gold may continue to hold above the $1847 (100% expansion) to $1857 (61.8% expansion) region amid the failed attempt to test the September low ($1849), with a move above the Fibonacci overlap around $1907 (100% expansion) to $1920 (161.8% expansion) bringing the $1956 (23.6% expansion) area on the radar.
- Need a break of the monthly high ($1966) to open up the $1971 (100% expansion) to $1985 (261.8% expansion) region, with the next area of interest coming n around $2016 (38.2% expansion) to $2025 (78.6% expansion).

--- Written by David Song, Currency Strategist
Follow me on Twitter at @DavidJSong


