


EUR/USD Rate Talking Points
EUR/USD pulls back from a fresh weekly high (1.1755) ahead of the update to the US Non-Farm Payrolls (NFP) report, but the Relative Strength Index (RSI) may offer a bullish signal as it reverses ahead of oversold territory and approaches trendline resistance.
EUR/USD Bullish Price Sequence Pushes RSI Towards Trendline Resistance
EUR/USD extends the series of higher highs and lows from earlier this week to broadly track the advance in global equity prices, and swings in trader sentiment may continue to influence the exchange rate even though the European Central Bank (ECB) continues to endorse a dovish forward guidance for monetary policy.
In a recent speech, President Christine Lagarde warns that “the last decade has been defined by a persistent decline in inflation among advanced economies,” with the central bank head going onto say that “the wider discussion today, however, is whether central banks should commit to explicitly make up for inflation misses when they have spent quite some time below their inflation goals” as the ECB carries out its strategy review.
In turn, President Lagarde points out that “market-based measures of longer-term inflation expectations have fallen notably,” but it seems as though the Governing Council is in no rush to alter the path for monetary policy as the central bank argues that “it is too early to draw any firm conclusions.”
It seems as though the ECB will stick to the sidelines at its next meeting on October 29 as the central bank insists that the EUR 1.350 trillion envelope for the Pandemic Emergency Purchase Programme (PEPP) “should be considered a ceiling rather than a target,” and it remains to be seen if key data prints coming out of the Euro Area will influence the near-term outlook for EUR/USD as the core rate of inflation is expected to increase to 0.5% from 0.4% per annum in August.
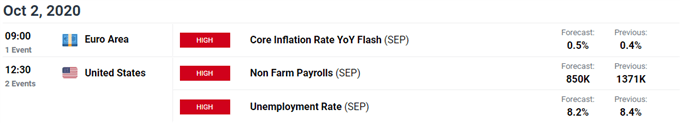
Meanwhile, the update to the NFP report is anticipated to show the US economy adding 850K jobs in September following the 1.371 million expansion the month prior, but the data may do little to sway the Federal Reserve as the central bank vows to “increase its holdings of Treasury securities and agency mortgage-backed securities at least at the current pace.”
In turn, current market trends may continue to influence EUR/USD in October as the rebound from the September low (1.1612) largely mimics the recovery in global equity prices, and the tilt in retail sentiment looks poised to persist as traders have been net-short the pair since mid-May.
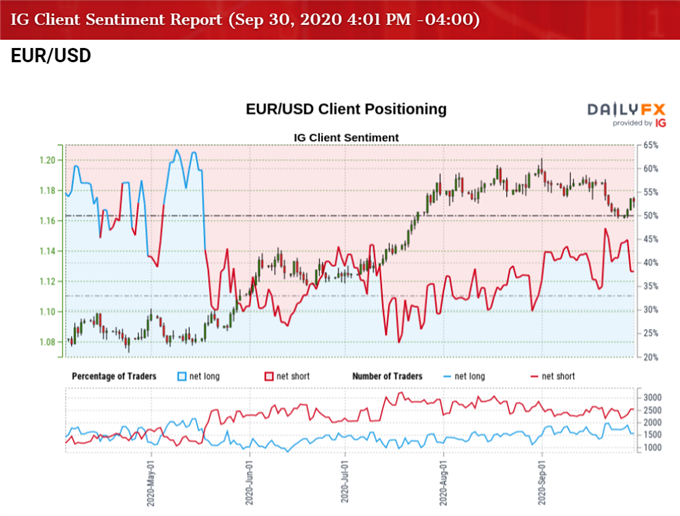
The IG Client Sentiment report shows only 38.79% of traders are net-long EUR/USD, with the ratio of traders short to long at 1.58 to 1. The number of traders net-long is 1.32% lower than yesterday and 10.66% lower from last week, while the number of traders net-short is 2.56% higher than yesterday and 7.07% lower from last week.
The decline in net-short interest comes as EUR/USD extends the series of higher highs and lows from earlier this week, but the drop in net-long position has spurred an even greater tilt in retail sentiment as 44.67% of traders were net-long the pair earlier this week.
The crowding behavior in EUR/USD looks poised to persist even though the Fed’s balance sheet sits at its highest level since June, and the pullback from the yearly high (1.2011) may prove to be an exhaustion in the bullish price action rather than a change in trend as it largely mimics the correction in global equity prices.
With that said, the Relative Strength Index (RSI) may offer a near-term signal as it reverses ahead of oversold territory and approaches trendline resistance, with a break of the downward trend to instill a bullish outlook for EUR/USD.

Sign up and join DailyFX Currency Strategist David Song LIVE for an opportunity to discuss key themes and potential trade setups surrounding foreign exchange markets.
EUR/USD Rate Daily Chart
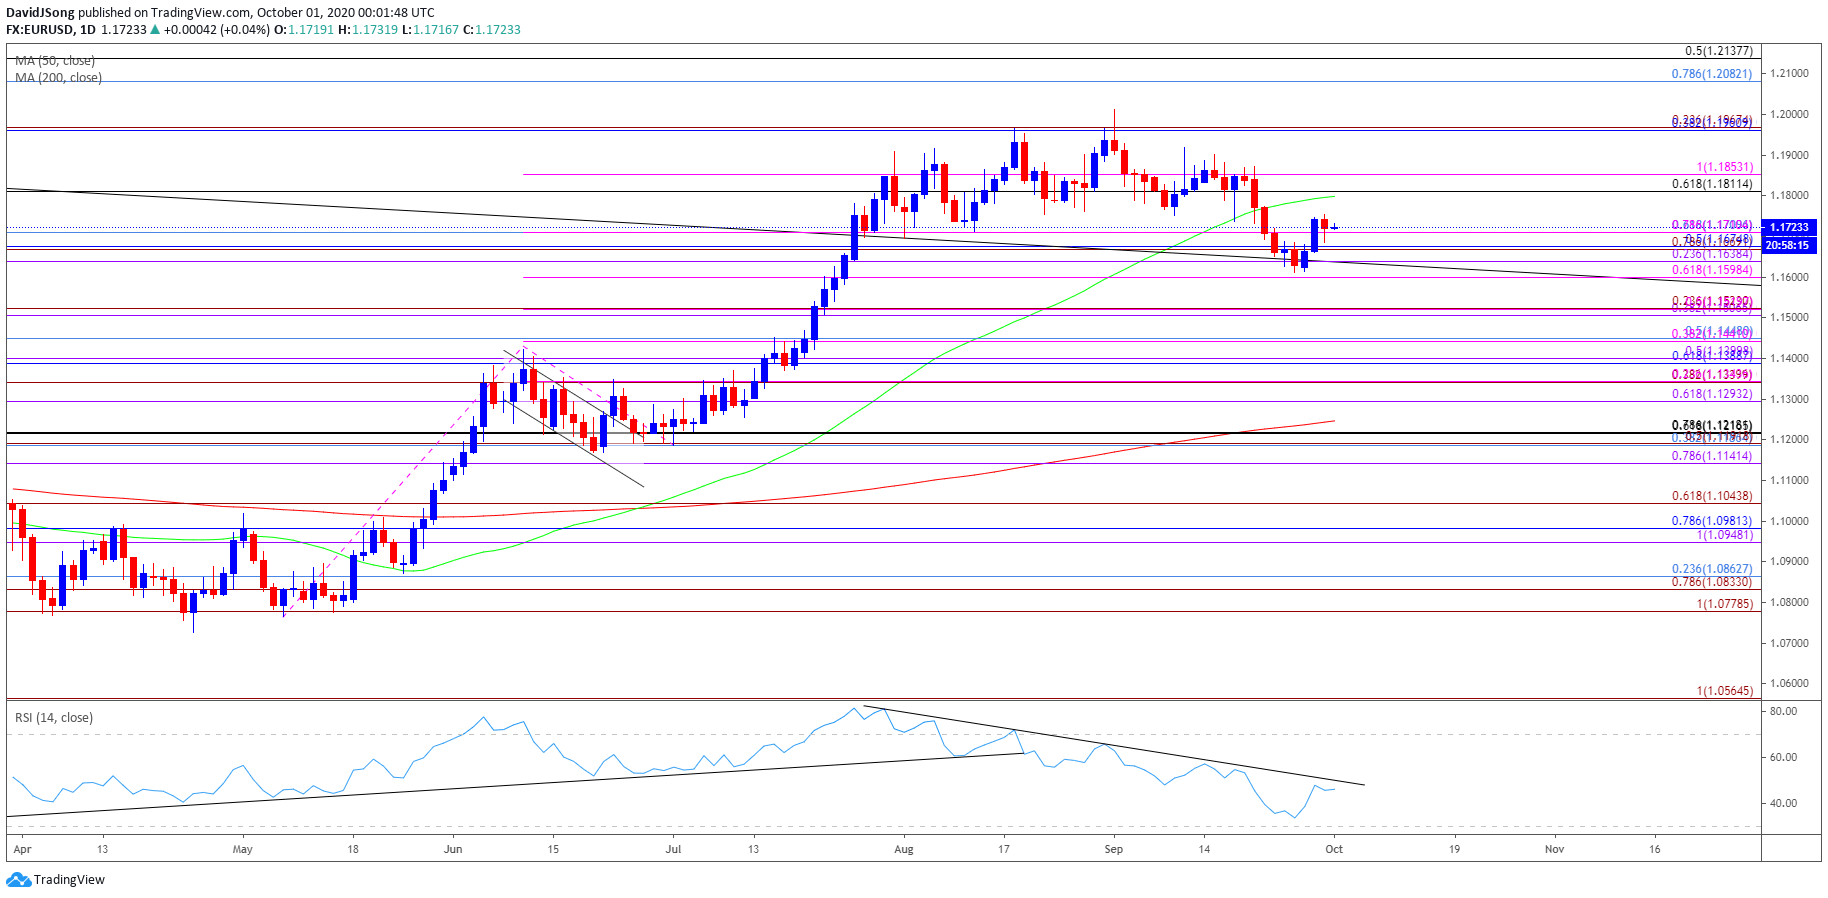
Source: Trading View
- Keep in mind, a ‘golden cross’ materialized in EUR/USD towards the end of June as the 50-Day SMA (1.1799) crossed above the 200-Day SMA (1.1247), with the moving averages still tracking the positive slopes from earlier this year.
- At the same time, a bull flag formation panned out following the failed attempt to close below the 1.1190 (38.2% retracement) to 1.1220 (78.6% expansion) region in July, with the Relative Strength Index (RSI) helping to validate the continuation pattern as the oscillator bounced along trendline support to preserve the upward trend from March.
- However, the EUR/USD rally stalled following the failed attempt to close above the 1.1960 (38.2% retracement) to 1.1970 (23.6% expansion) region, with the RSI highlighting a similar dynamic as it slipped below 70 to ultimately break trendline support.
- A similar scenario materialized in September even though EUR/USD traded to a fresh yearly high (1.2011) at the start of the month, with the exchange rate taking out the August low (1.1696) after staging another failed attempt to close above the 1.1960 (38.2% retracement) to 1.1970 (23.6% expansion) region.
- Nevertheless, the pullback from the yearly high (1.2011) may prove to be an exhaustion in the bullish price action rather than a change in trend amid the failed attempt to break/close below the 1.1600 (61.8% expansion) to 1.1640 (23.6% expansion) region, with the RSI highlighting a similar dynamic as it reverses ahead of oversold territory.
- Will keep a close eye on the RSI as it approaches trendline resistance, with a break of the downward trend from the end of July to offer a bullish signal.
- The move back above the Fibonacci overlap around 1.1670 (50% retracement) to 1.1710 (61.8% retracement) brings the 1.1810 (61.8% retracement) to 1.1850 (100% expansion) region on the radar, with the next area of interest coming in around 1.1960 (38.2% retracement) to 1.1970 (23.6% expansion).

--- Written by David Song, Currency Strategist
Follow me on Twitter at @DavidJSong


