


EUR/USD Rate Talking Points
EUR/USD extends the rebound from the monthly low (1.1753) as the European Central Bank (ECB) plans to carry out the “pandemic emergency purchase programme (PEPP) with a total envelope of €1,350 billion,” and the exchange rate may continue to track the August range ahead of the Federal Reserve meeting even though the Relative Strength Index (RSI) retains the downward trend carried over from the end of July.
EUR/USD Analysis: Wait-and-See ECB Guidance Keeps August Range Intact
EUR/USD retraces the pullback from the 2020 high (1.2011) as the ECB sticks to the status quo and pledges to “conduct net asset purchases under the PEPP until at least the end of June 2021,” with the central bank going onto say that “the outlook for real GDP growth has been revised up for 2020 and is largely unchanged for 2021 and 2022.”
The updated staff projections suggest the ECB is in no rush to alter the path for monetary policy as “incoming data and survey results indicate a continued recovery of the euro area economy,” and it seems as though the Governing Council will retain a wait-and-see approach throughout the remainder of 2020 as President Christine Lagarde and Co. insist that “net purchases under our asset purchase programme (APP) will continue at a monthly pace of €20 billion, together with the purchases under the additional €120 billion temporary envelope until the end of the year.”
In turn, current market trends may keep EUR/USD afloat even though the ECB “continues to stand ready to adjust all of its instruments,” and the crowding behavior in the US Dollar looks poised to persist ahead of the Federal Open Market Committee (FOMC) interest rate decision on September 16 as retail trades have been net-short the pair since mid-May.
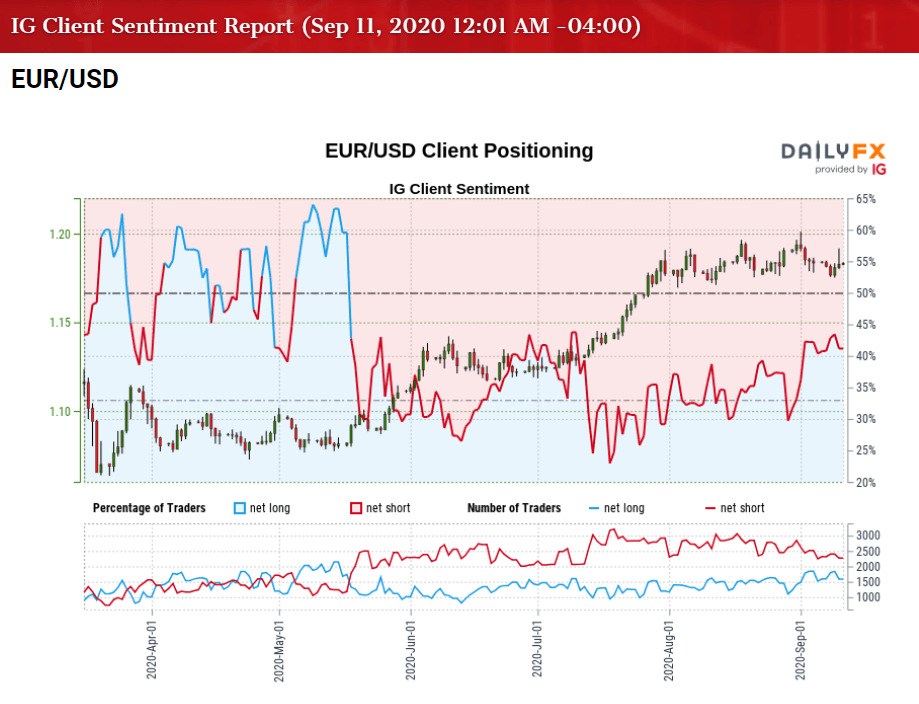
The IG Client Sentiment report shows only 41.95% of traders are net-long EUR/USD with the ratio of traders short to long at 1.38 to 1. The number of traders net-long is 11.00% lower than yesterday and 11.99% lower from last week, while the number of traders net-short is 4.55% lower than yesterday and 7.94% lower from last week.
Open interest for EUR/USD has fallen 9.68% from last week amid the adjustment in retail positioning, but the crowding behavior in the US Dollar looks poised to persist as 43.83% of traders were net-long the pair earlier this week.
With that said, the tilt in retail sentiment may continue to coincide with bullish behavior in EUR/USD as it tags a fresh yearly high (1.2011) in September, and current market trends may keep the exchange rate afloat ahead of the FOMC meeting even though the Relative Strength Index (RSI) retains the downward trend carried over from the end of July.

Sign up and join DailyFX Currency Strategist David Song LIVE for an opportunity to discuss key themes and potential trade setups surrounding foreign exchange markets.
EUR/USD Rate Daily Chart
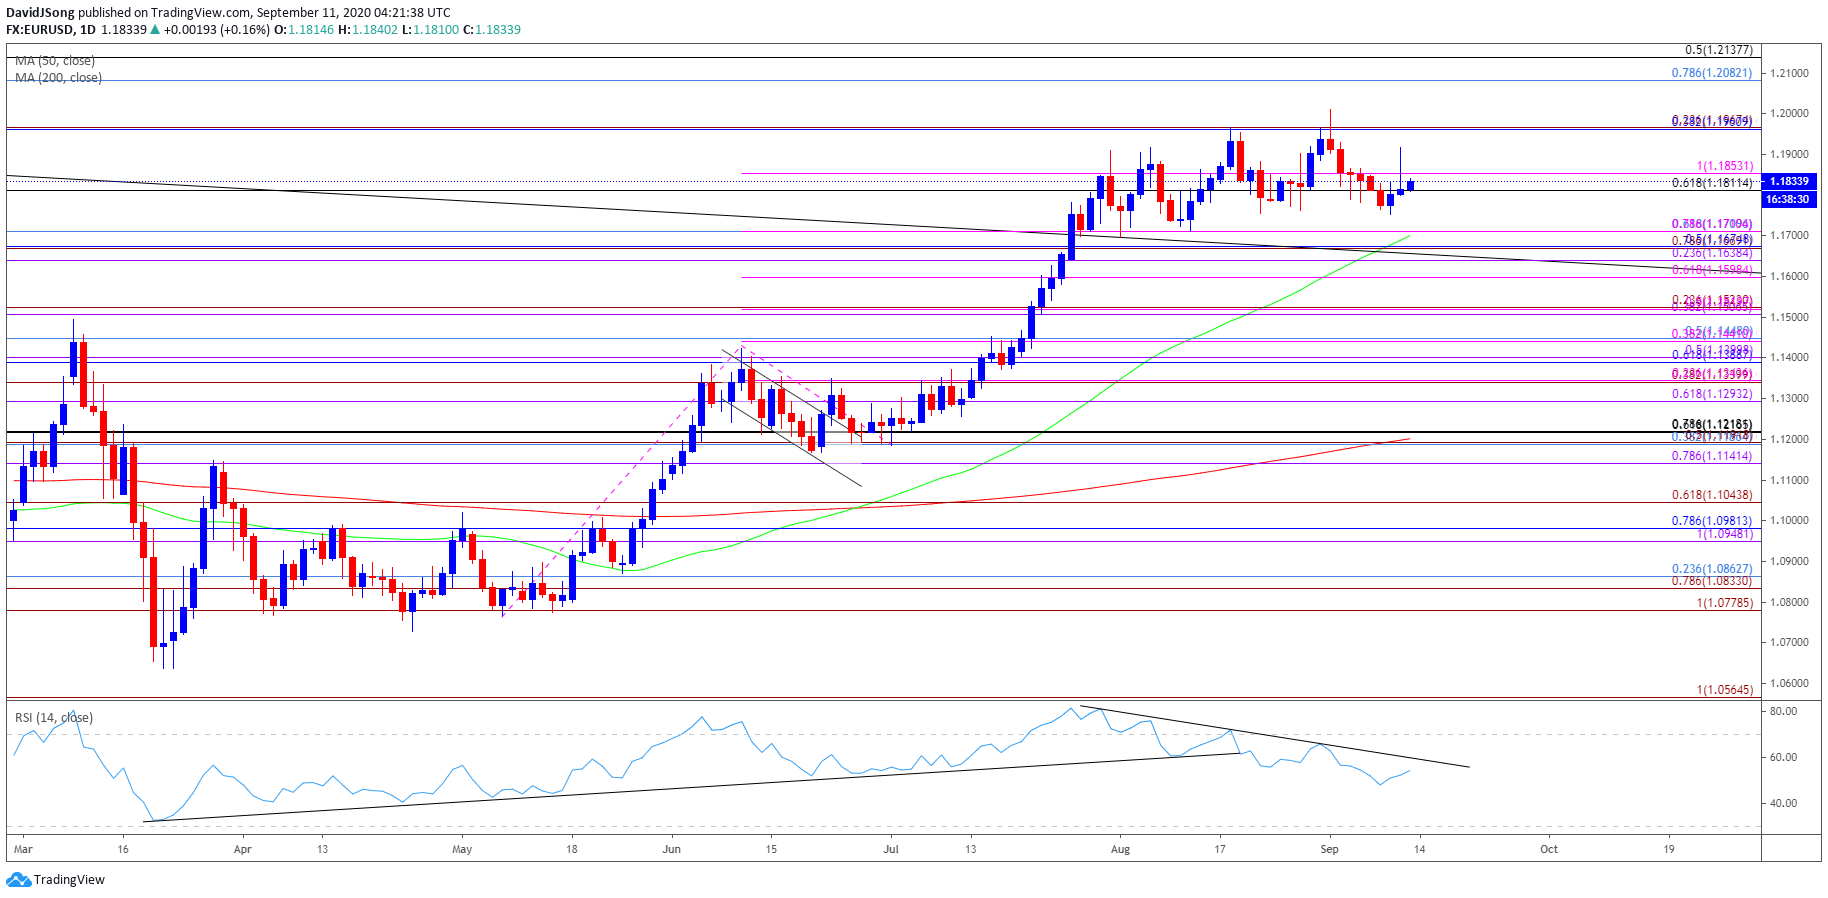
Source: Trading View
- Keep in mind, a ‘golden cross’ materialized in EUR/USD towards the end of June as the 50-Day SMA (1.1700) crossed above the 200-Day SMA (1.1201), with the moving averages extending the positive slopes into the second half of the year.
- At the same time, a bull flag formation panned out following the failed attempt to close below the 1.1190 (38.2% retracement) to 1.1220 (78.6% expansion) region in July, with the Relative Strength Index (RSI) helping to validate the continuation pattern as the oscillator bounced along trendline support to preserve the upward trend from March.
- However, the EUR/USD rally stalled following the failed attempt to close above the 1.1960 (38.2% retracement) to 1.1970 (23.6% expansion) region, with the RSI highlighting a similar dynamic as it slipped below 70 to ultimately break trendline support.
- A similar scenario appears to have materialized in September even though EUR/USD traded to a fresh yearly high (1.2011) at the start of the month, with the exchange rate staging another failed attempt to close above the 1.1960 (38.2% retracement) to 1.1970 (23.6% expansion) region.
- EUR/USD may continue to consolidate as the RSI preserves the downward trend carried over from the end of July, but the exchange rate appears to be reversing course ahead of the Fibonacci overlap around 1.1670 (50% retracement) to 1.1710 (61.8% retracement), which lines up with the August low (1.1696).
- Future developments in the RSI may help to validate a near-term breakout in EUR/USD once the indicator takes out the downward trend, with a move above 70 likely to be accompanied by a further appreciation in the exchange rate like the behavior seen in July.
- Need a closing price above the Fibonacci overlap around 1.1810 (61.8% retracement) to 1.1850 (100% expansion) to bring the 1.1960 (38.2% retracement) to 1.1970 (23.6% expansion) region back on the radar, with the May 2018 high (1.1996) up next.
--- Written by David Song, Currency Strategist
Follow me on Twitter at @DavidJSong


