


EUR/USD Rate Talking Points
EUR/USD extends the series of higher highs and lows from earlier this week to take out the January high (1.1495), with the appreciation in the exchange rate pushing the Relative Strength Index (RSI) into overbought territory for the third time in 2020.
EUR/USD Rally Pushes RSI Into Overbought Zone for Third Time in 2020
EUR/USD trades to a fresh 2020 high (1.1602) despite the bearish reaction to the EUR 750B European COVID-19 recovery fund, and current market conditions may keep the exchange rate afloat as a bull flag unfolds in July.
The RSI helped to validate the continuation pattern as the oscillator bounced along trendline support to preserve the upward trend from March, and the bullish price action in EUR/USD may persist as long as the indicator holds above 70 and mimics the movements seen in June.
In turn, EUR/USD may continue to retrace the decline from 2018 as it clears the 2019 high (1.1570), with the recent appreciation in the exchange rate accompanied by signs of crowding behavior in the US Dollar.
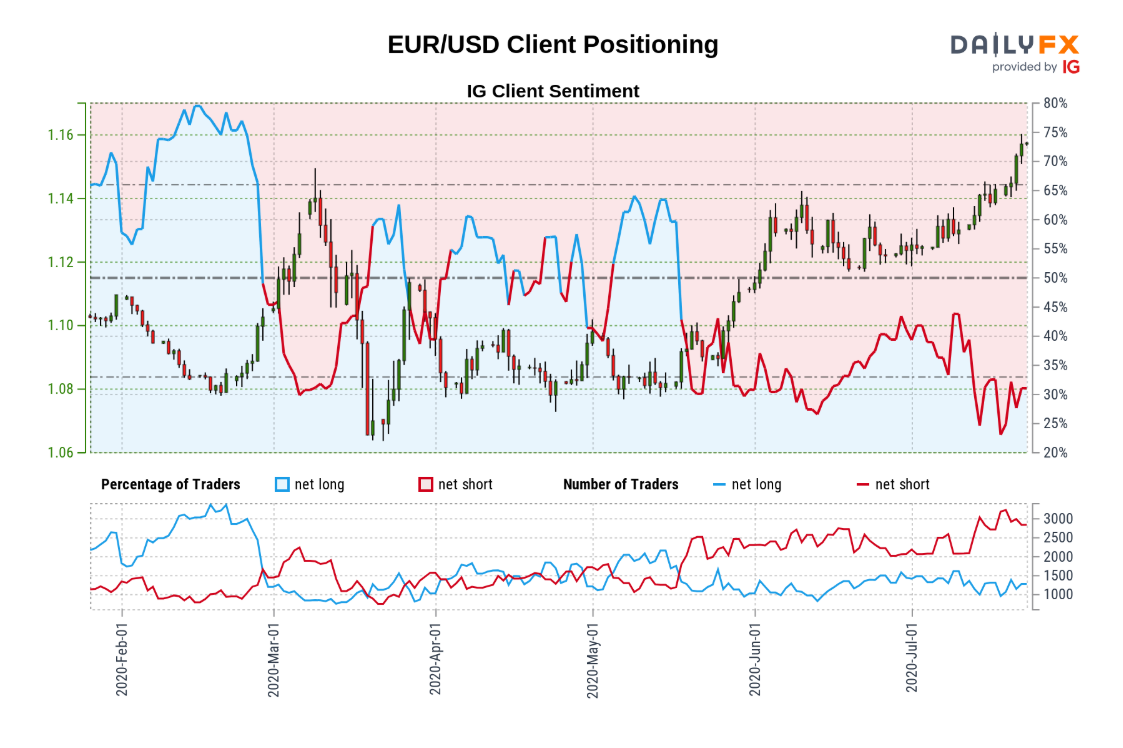
The IG Client Sentiment report shows the retail crowd has been net-short EUR/USD since mid-May, with the ratio of traders short to long at 2.13 to 1 as only 31.92% are net-long the pair. The number of traders net-long is 16.07% higher than yesterday and 2.55% higher from last week, while the number of traders net-short is 4.26% lower than yesterday and 0.87% lower from last week.
It seems as though the EUR/USD rally is fueling net-long interest as the exchange rate trades to a fresh 2020 high (1.1602), but the decline in net-short positions could be a signal of stops getting triggered ahead of the Federal Reserve interest rate decision on July 29 amid the crowing behavior in the US Dollar.
With that said, EUR/USD may continue to carve a series of higher highs and lows as the RSI pushes into overbought territory, but it remains to be seen if the extreme reading will persist for a number of days like the behavior seen in June.

Sign up and join DailyFX Currency Strategist David Song LIVE for an opportunity to discuss key themes and potential trade setups surrounding foreign exchange markets.
EUR/USD Rate Daily Chart
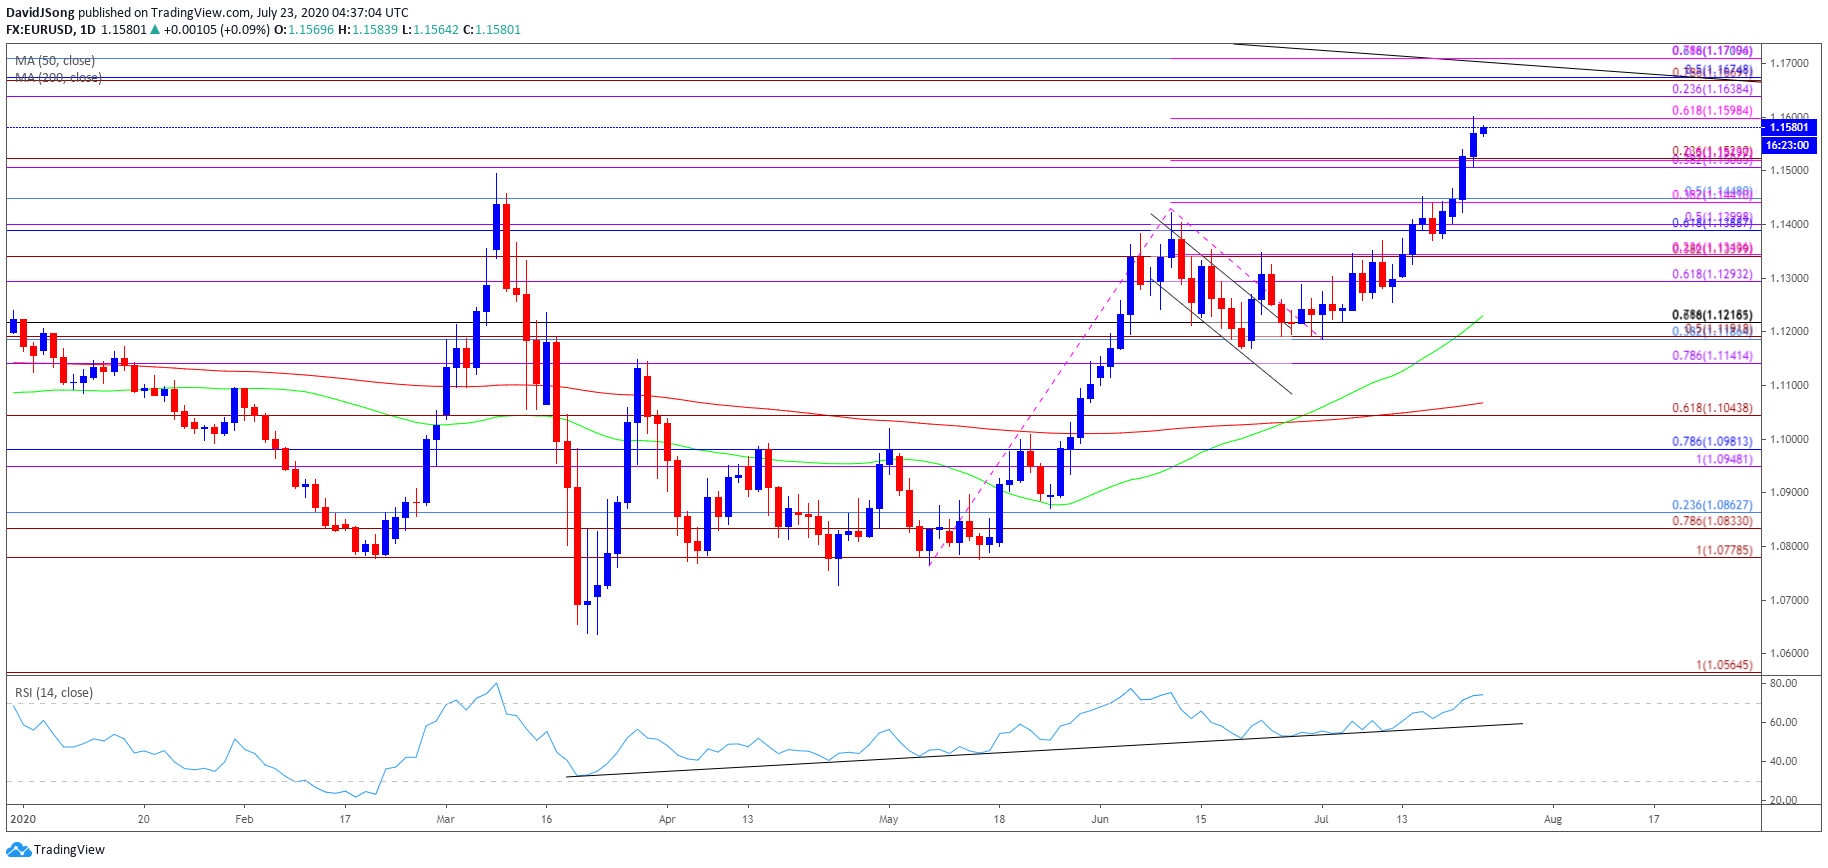
Source: Trading View
- Keep in mind, EUR/USD failed to test the March high (1.1495) in June amid the lack of momentum to break/close above the Fibonacci overlap around 1.1430 (23.6% expansion) to 1.1450 (50% retracement), with the Relative Strength Index (RSI) pulling back from overbought territory during the same period after triggering an extreme reading for the second time in 2020.
- Nevertheless, a ‘golden cross’ materializing towards the end of June as the 50-Day SMA (1.1230) crossed above the 200-Day SMA (1.1068), with the RSI bouncing along trendline support to retain the bullish trend from earlier this year.
- Will keep a close eye on the RSI as it pushes into overbought territory for the third time in 2020, with the bullish price action in EUR/USD like to persist as long as the indicator holds above 70 amid the behavior seen in June.
- The bull flag formation unfolds following the failed attempt to close below the 1.1190 (38.2% retracement) to 1.1220 (78.6% expansion) region in July, with the continuation pattern producing a break of the 2019 high (1.1570) as EUR/USD extends the series of higher highs and lows from earlier this week.
- Need a close above 1.1590 (61.8% expansion) to open up the 1.1640 (23.6% expansion) region, with the next area of interest coming in around 1.1670 (50% retracement) to 1.1710 (61.8% retracement).

--- Written by David Song, Currency Strategist
Follow me on Twitter at @DavidJSong


