Australian Dollar Talking Points
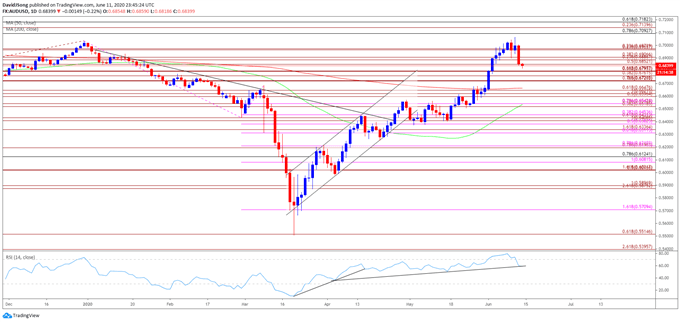
AUD/USD extends the pullback from the yearly high (0.7064) following the failed attempt to test the July 2019 high (0.7082), and the exchange rate may face a larger correction as the Relative Strength Index (RSI) falls back from overbought territory and offers a textbook sell signal.
AUD/USD Outlook Mired by RSI Sell Signal Ahead of Fed Testimony
The Australian Dollar has outperformed against all of its major counterparts in May, but the bullish behavior has started to abate following the Federal Reserve interest rate decision as the central bank appears to be on track to retain the current policy in the second half of 2020.
It seems as though the Federal Open Market Committee (FOMC) will continue to endorse a dovish forward after expanding the scope of the Main Street Lending Program as the central bank remains committed in “using our full range of tools to support the economy in this challenging time.”
However, it remains to be seen if the FOMC will deploy more unconventional tools over the coming months as Chairman Jerome Powell rules out a negative interest rate policy (NIRP), and it seems as though the committee is in no rush to implement a yield-curve control program as “whether such an approach would usefully complement our main tools remains an open question.”
In turn, Chairman Powell may strike a less dovish tone in front of US lawmakers as the central bank head is scheduled to testify in front of Congress starting on June 16, and the FOMC as well as the Reserve Bank of Australia (RBA) may carry out a wait-and-see approach over the coming months as Fed officials insist that “some indicators suggest a stabilization or even a modest rebound in some segments of the economy.”
With that said, AUD/USD may struggle to hold its ground ahead of the next RBA meeting on July 7 as the FOMC emphasizes that “market functioning has improved since the strains experienced in March,” and the exchange rate may exhibit a more bearish behavior over the coming days as the Relative Strength Index (RSI) falls back from overbought territory and offers a textbook sell signal.


Sign up and join DailyFX Currency Strategist David Song LIVE for an opportunity to discuss potential trade setups.
AUD/USD Rate Daily Chart

Source: Trading View
- Keep in mind, the monthly opening range was a key dynamic for AUD/USD in the fourth quarter of 2019 as the exchange rate carved a major low on October 2, with the high for November occurring during the first full week of the month, while the low for December materialized on the first day of the month.
- The opening range for 2020 showed a similar scenario as AUD/USD marked the high of the month on January 2, with the exchange rate carving the February high during the first week of the month.
- However, the opening range for March was less relevant, with the high of the month occurring on the 9th, the same day as the flash crash.
- Nevertheless, the advance from the yearly low (0.5506) gathered pace as AUD/USD broke out of the April range, with the exchange rate clearing the February high (0.6774) as the Relative Strength Index (RSI) pushed into overbought territory.
- Recent price action warns of a near-term correction in AUD/USD as the advance from earlier this month fails to produce a test of the July 2019 high (0.7082), with the RSI highlighting a similar dynamic as the oscillator pushes below 70 and offers a textbook sell signal.
- Will keep a close eye on the RSI as it falls back from overbought territory and threatens the bullish formation from earlier this year.
- The failed attempt to test the 0.7090 (78.6% retracement) hurdle has pushed AUD/USD towards the Fibonacci overlap around 0.6720 (78.6% expansion) to 0.6800 (61.8% expansion), with the next region of interest coming in around 0.6600 (50% expansion) to 0.6650 (61.8% expansion).


--- Written by David Song, Currency Strategist
Follow me on Twitter at @DavidJSong


