


Canadian Dollar Talking Points
USD/CAD appears to be reversing course ahead of the 2016 high (1.4690) and the exchange rate may stage a larger pullback over the remainder of the month as the Relative Strength Index (RSI) appears to be on its way to flash a textbook sell signal.
USD/CAD Levels to Watch Following Failed Attempt to Test 2016 High
USD/CAD consolidates as the Federal Reserve announces additional measures to combat the supply/demand shock, and the exchange rate may continue to pullback from the fresh yearly high (1.4667) as major central banks take unprecedented steps to counter the weakening outlook for growth.
The Federal Open Market Committee (FOMC) appears to be on track to unveil more measures as Chairman Jerome Powell and Co plan toestablish“a Main Street Business Lending Program to support lending to eligible small-and-medium sized businesses,” and its seems as though the global community of central banks will rely on unconventional tools to support their economy as the Bank of Canada (BoC) launches the Standing Term Liquidity Facility (STLF), with the program intended to “provide loans to eligible financial institutions in need of temporary liquidity support.”
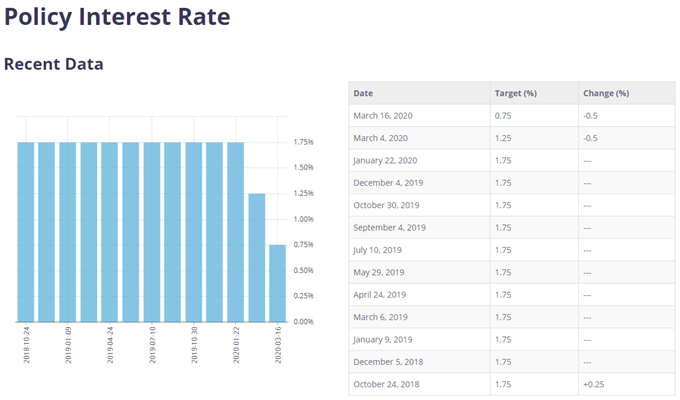
With that said, the BoC may come under pressure to deliver a rate cut at the next meeting on April 15 as the “Governing Council stands ready to adjust monetary policy further,” and the Canadian Dollar may continue to depreciate against its US counterpart as the greenback benefits from the flight to safety.
In turn, USD/CAD may continue to exhibit a bullish behavior over the coming months, but the advance from the 2020 low (1.2957) seems to have stalled ahead of the 2016 high (1.4690) as the Relative Strength Index (RSI) appears to be on its way to flash a textbook sell signal.

Sign up and join DailyFX Currency Strategist David Song LIVE for an opportunity to discuss potential trade setups.
USD/CAD Rate Daily Chart
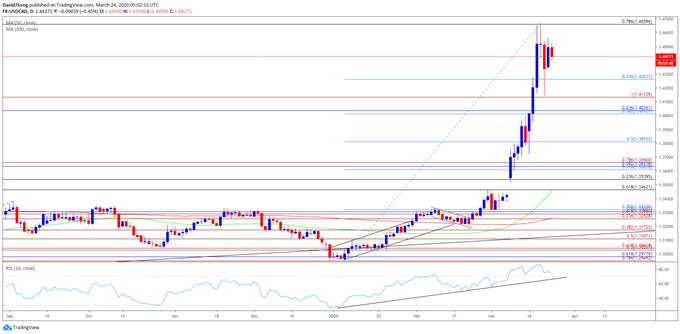
Source: Trading View
- Keep in mind, the near-term strength in USD/CAD emerged following the failed attempt to break/close belowthe Fibonacci overlap around 1.2950 (78.6% expansion) to 1.2980 (61.8% retracement), with the yearly opening range highlighting a similar dynamic as the exchange rate failed to test the 2019 low (1.2952) during the first full week of January.
- There appears to be shift in USD/CAD behavior as the exchange rate breaks out of the range from the fourth quarter of 2019 and clears the October high (1.3383), with the Relative Strength Index (RSI) highlighting a similar dynamic as the oscillator continues to track the upward trend from earlier this year.
- However, the advance from the 2020 low (1.2957) seems to have stalled ahead of the 2016 high (1.4690), and the exchange rate may stage a larger pullback over the coming days as the Relative Strength Index (RSI) appears to be on its way to flash a textbook sell signal.
- Will keep a close eye on the RSI as it falls back from an extreme reading, with a break of the upward trend likely to be accompanied by a decline in the USD/CAD as the bullish momentum abates.
- In turn, the failed attempt to close above the 1.4660 (78.6% retracement) region may push USD/CAD back towards 1.4270 (23.6% retracement), with the next area of interest coming in around 1.4130 (100% expansion) followed by the Fibonacci overlap around 1.4020 (38.2% retracement) to 1.4040 (23.6% retracement).

--- Written by David Song, Currency Strategist
Follow me on Twitter at @DavidJSong


