


Gold Price Talking Points
The price of gold climbs to a fresh monthly high ($1681) as the coronavirus drags on the global supply chain, and the precious metal may exhibit a bullish behavior over the remainder of the month as the Relative Strength Index (RSI) breaks out of a bearish formation and pushes into overbought territory.
Gold Price Rally Pushes RSI Into Overbought Territory
Gold marks the longest winning streak since June, with the price for bullion advancing for the fifth consecutive day, and the disruption in the global supply chain may continue to heighten the appeal of the precious metal as it puts pressure on major central banks to implement lower interest rates.
It seems as though the People’s Bank of China (PBoC) will take additional steps to combat the coronavirus as officials insist that “China has sufficient policy space to support steady economic growth,” with the central bank going onto say that “the Chinese economy is expected to recover rapidly” after lowering the rate for its medium-term lending facility (MLF) to 3.15% from 3.25% on CNY 200B worth of loans.
It remains to be seen if the PBoC will announce additional measures as the central bank pledges to “implement the financial policies designed to support epidemic prevention and control efforts,” and the weakening outlook for global growth may trigger a response by the Federal Reserve as Chairman Jerome Powell tells US lawmakers that thecoronavirus “could lead to disruptions in China that spill over to the rest of the global economy.”
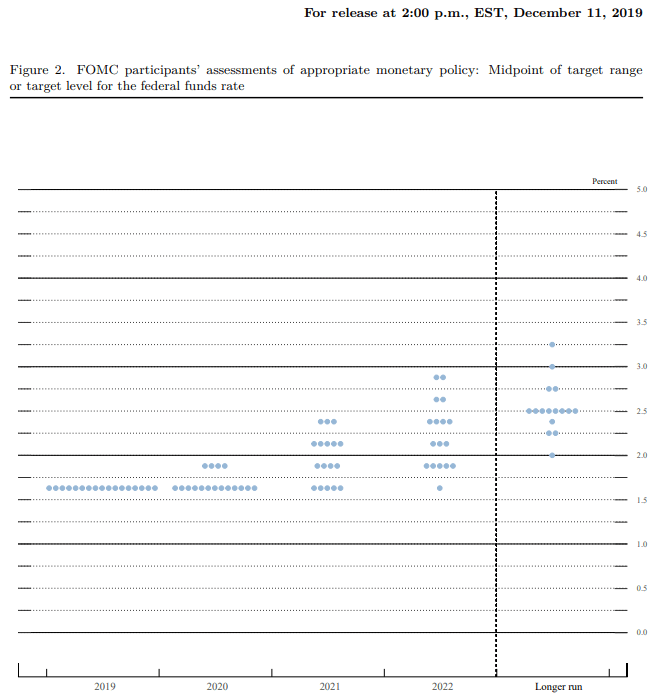
In turn, the Federal Open Market Committee (FOMC) adjust the forward guidance when the central bank updates the Summary of Economic Projections (SEP) at the next quarterly meeting in March, and a material shift in the interest rate dot-plot may keep gold prices afloat if Fed officials show a greater willingness to implement lower interest rates in 2020.

In fact, Fed Fund futures now show a greater than 80% probability for a rate cut in September, and the FOMC may change its tune over the coming months as “the threat of the coronavirus, in addition to its human toll, had emerged as a new risk to the global growth outlook.”
With that said, the price of gold may continue to exhibit a bullish behavior in 2020 as market participants look for an alternative to fiat-currencies, and the broader outlook for bullion remains constructive as the reaction to the former-resistance zone around $1447 (38.2% expansion) to $1457 (100% expansion) helped to rule out the threat of a Head-and-Shoulders formation as the region provided support.

Sign up and join DailyFX Currency Strategist David Song LIVE for an opportunity to discuss potential trade setups.
Gold Price Daily Chart
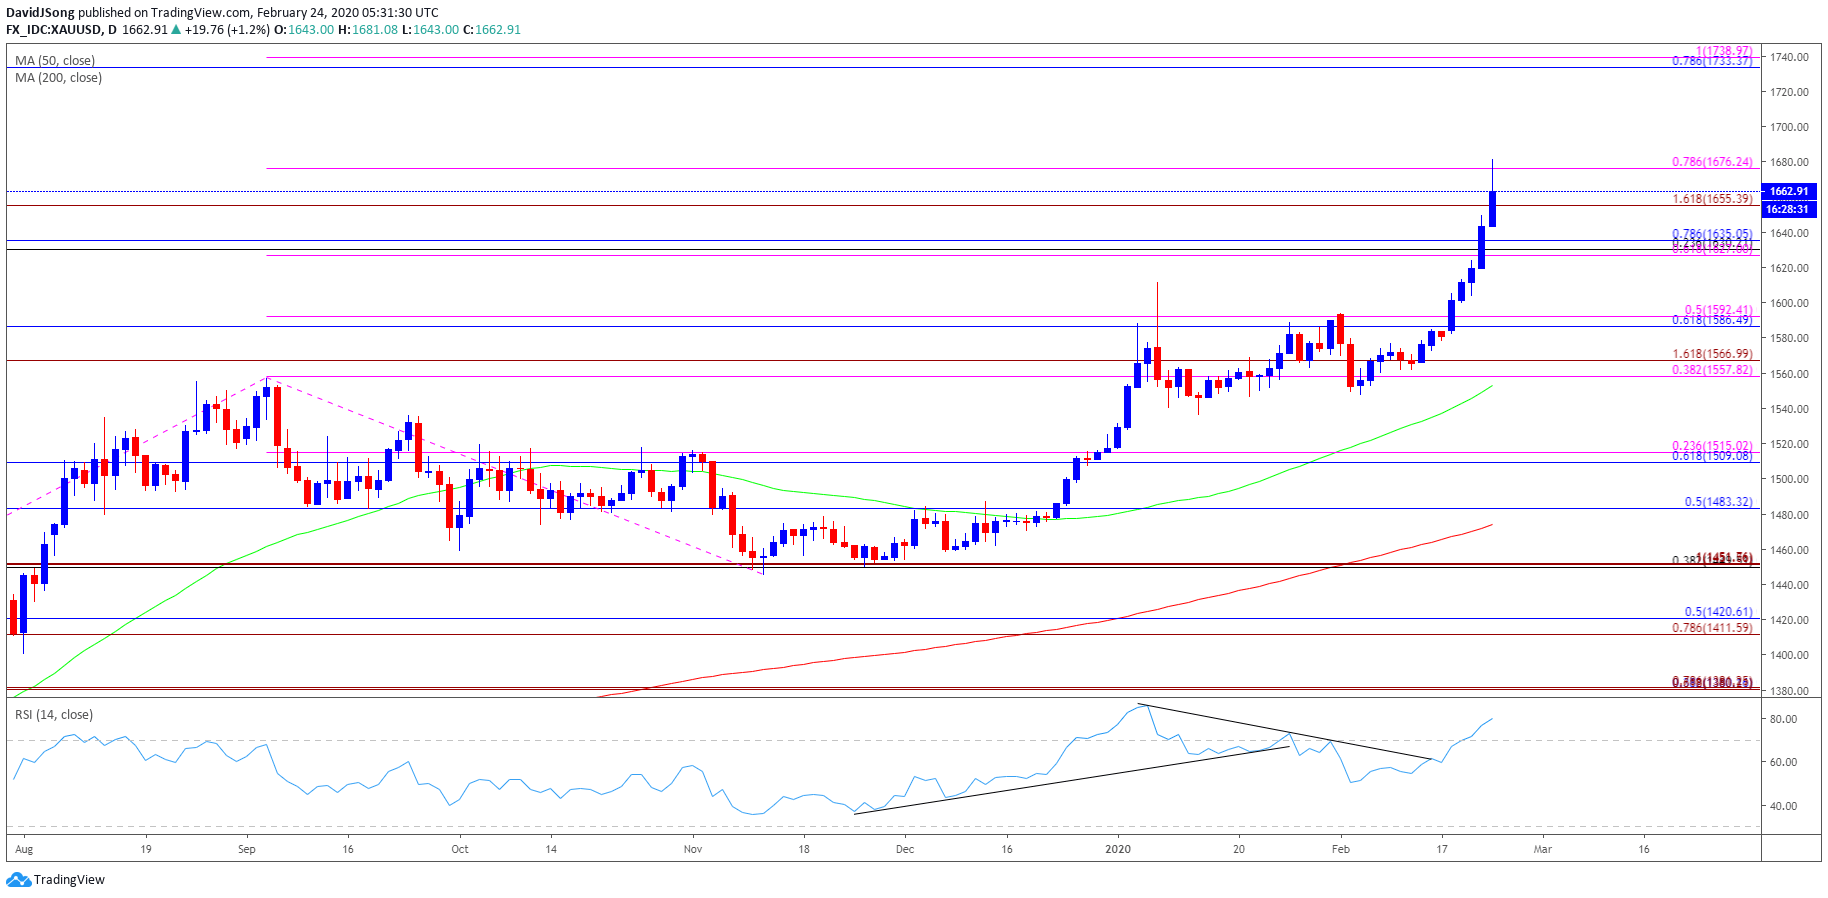
Source: Trading View
- The opening range for 2020 instilled a constructive outlook for the price of gold as the precious metal cleared the 2019 high ($1557), with the Relative Strength Index (RSI) pushing into overbought territory during the same period.
- A similar scenario materialized in February, with the price of gold marking the monthly low ($1548) during the first full week, while the RSI broke out of the bearish formation from earlier this year to push back into overbought territory.
- Need a close above the $1676 (78.6% expansion) region to open up the Fibonacci overlap around $1733 (78/6% retracement) to $1739 (100% expansion).

--- Written by David Song, Currency Strategist
Follow me on Twitter at @DavidJSong


