


Oil Price Talking Points
The price of oil approaches the 2019 high ($66.60) following the US airstrike on Iran, and recent price action instills a bullish outlook for crude as a ‘golden cross’ formation take shape.
Bullish Oil Price Outlook Supported by Golden Cross Formation
The 2020 opening range is in focus for the price of oil as it trades at an eight-month high, and fears of a supply-side shock may keep crude prices afloat as Iran pledges to retaliate to the death of general Qassim Soleimani.
Unlike the reaction to the Saudi Arabia drone attack, growing tension between the US and Iran may have a more prominent impact on oil prices as President Donald Trump insist that “the United States will quickly & fully strike back, & perhaps in a disproportionate manner.”

A disruption in oil output may put pressure on the Organization of the Petroleum Exporting Countries (OPEC) to boost production, but the group may emphasize its commitment to the ‘Declaration of Cooperation’ as Russia Energy Minister Alexander Novak pledges to uphold “the agreement signed on July 2 to extend the deal until April 1.”
It remains to be seen if OPEC and its allies will make a meaningful adjustment at the next meeting starting on March 5 as the group agreed to reduce output by another 500K b/d at the last conference in December, and the producers may regulate the energy market throughout 2020 as US production sits at a record high.
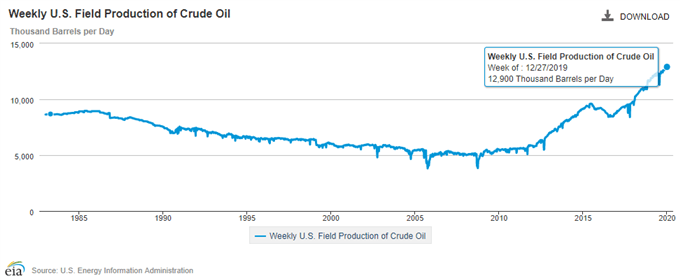
Recent figures coming out of the US Energy Information Administration (EIA) showed weekly field production holding steady at 12,900K in the week ending December 27, and OPEC and its allies may continue to counter the rise in US output as U.A.E. Energy Minister Suhail Mohammed Al Mazrouei insists that “OPEC and OPEC+ members will be satisfiedwith a price ranging between $60 and $70 per barrel or even $80.”
However, the Phase One trade deal may tame the recent rise in oil prices as the US and China, the two largest consumers of oil, appear to be on track sign the agreement on January 15, and OPEC may find it difficult to extend its production-cutting measures as “oil demand is expected to grow by 1.1 mb/d.”
With that said, fears of a supply-side shock along with the commitment to the ‘Declaration of Cooperation’ may push the price of oil towards the 2019 high ($66.60), and recent price action instills a bullish outlook for crude as a golden cross formation take shape.
Sign up and join DailyFX Currency Strategist David Song LIVE for an opportunity to discuss key themes and potential trade setups.
Crude Oil Daily Chart
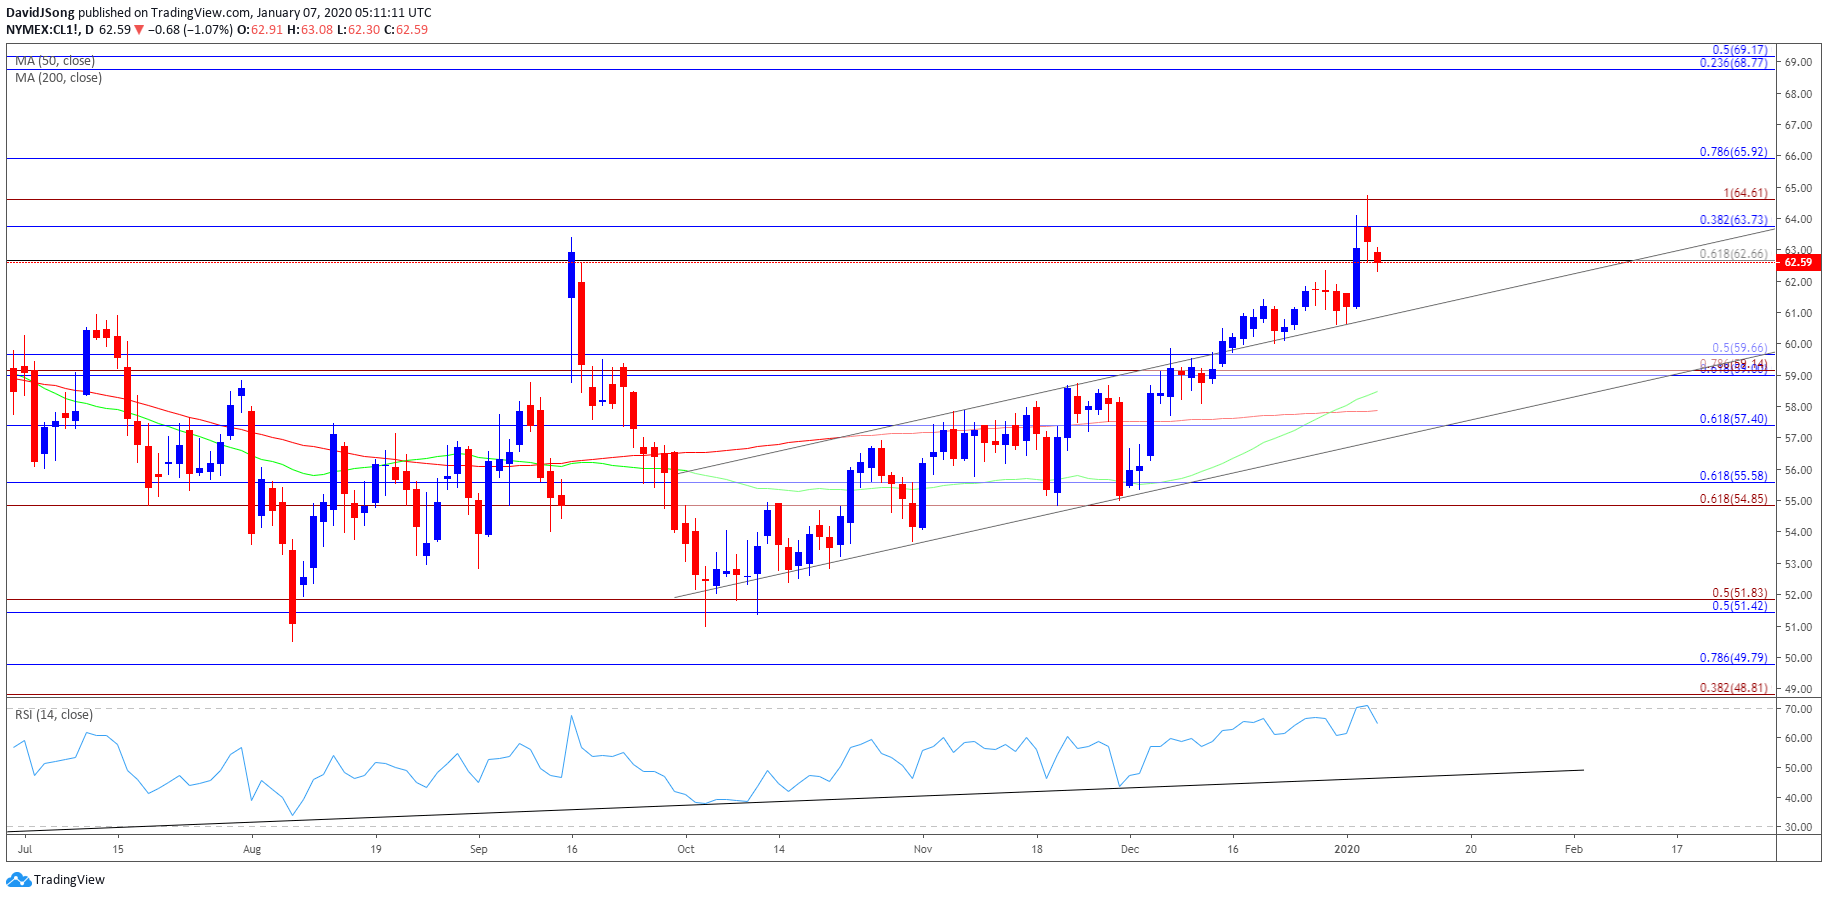
Source: Trading View
- Crude appears to be on track to test the 2019 high ($66.60) as it clears the September high ($63.38), with the next topside hurdle coming in around $68.80 (23.6% retracement) to $69.20 (50% retracement).
- However, failure to close above the Fibonacci overlap around $63.70 (38.2% retracement) to $64.60 (100% expansion) may raises the scope for a short-term pullback in the price of oil as the Relative Strength Index (RSI) fails to push into overbought territory.
- In turn, the overlap around $59.00 (61.8% retracement) to $59.70 (50% retracement) sits on the radar, but the recent crossover in the 50-Day SMA ($58.49) and 200-Day SMA ($57.88) casts a bullish outlook for crude as a ‘golden cross’ takes shape.
- Need a close above the Fibonacci overlap around $63.70 (38.2% retracement) to $64.60 (100% expansion) to bring the $65.90 (78.6% retracement) on the radar.

--- Written by David Song, Currency Strategist
Follow me on Twitter at @DavidJSong.


