


Gold Price Talking Points
The price of gold continues to track sideways amid the lack of detail surrounding the US-China trade deal, but the Relative Strength Index (RSI) foreshadows a potential change in market behavior as the oscillator breaks out of the bearish formation from earlier this year.
Gold to Track November Range with US-China to Sign Trade Deal in 2020
The price of gold trades in a narrow range even though US Treasury Secretary Steven Mnuchin sees the Phase One trade deal being signed in January, and the precious metal may continue to consolidate over the coming days as market participation is likely to abate ahead of the holiday period.
Looking ahead, the shift in US trade policy may continue to impact financial markets in 2020 as the Trump administration remains reluctant to rollback tariffs, and it seems as though the US will renegotiate the current arrangement with Europe as the Office of the United States Trade Representative (USTR) initiates “a process to assess increasing the tariff rates and subjecting additional EU products to the tariffs.”
The threat of a US-EU trade war may push the Federal Reserve to alter the forward guidance, and the central bank could be forced to reestablish its rate easing cycle as St. Louis Fed President James Bullard, a 2019 voting member on the Federal Open Market Committee (FOMC), warns that the board will “have to consider additional insurance in the meetings ahead” amid the weakening outlook for global growth.
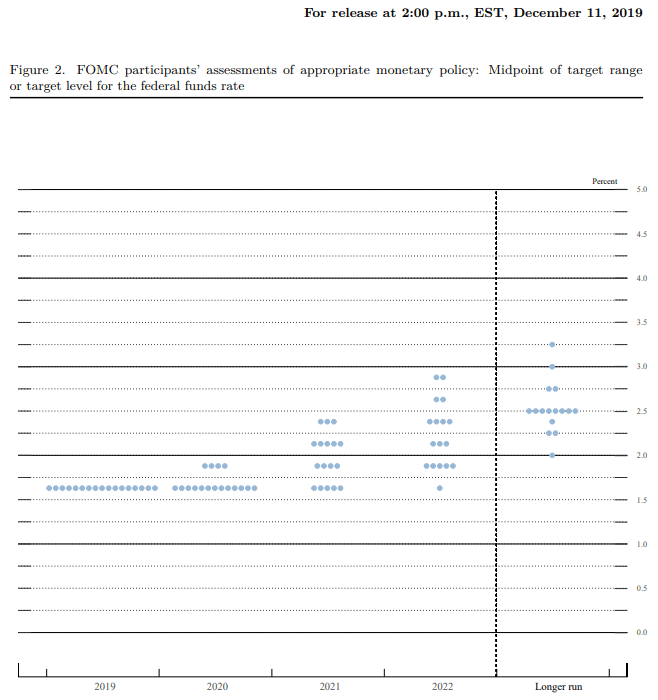
In turn, Fed officials may project a lower trajectory for the benchmark interest rate when the central bank updates the Summary of Economic Projections (SEP) in March, but the FOMC looks poised to retain the current policy at the next rate decision on January 29 as Chairman Jerome Powell and Co. insist that the “economic outlook remains a favorable one despite global developments and ongoing risks.”
With that said, Fed officials may change their tune over the coming months, and speculation for lower interest rates along with the weakening outlook for global growth may keep gold prices afloat as market participants look for an alternative to fiat-currencies.
Moreover, the reaction to the former-resistance zone around $1447 (38.2% expansion) to $1457 (100% expansion) helps to rule out the threat of a Head-and-Shoulders formation as the region appears to be acting as support.
Sign up and join DailyFX Currency Strategist David Song LIVE for an opportunity to discuss potential trade setups.
Gold Price Daily Chart

Source: Trading View
- Keep in mind, the broader outlook for gold prices remain constructive as both price and the Relative Strength Index (RSI) clear the bearish trends from earlier this year, with the precious metal trading to a fresh yearly-high ($1557) in September.
- At the same time, the reaction to the Fibonacci overlap around $1447 (38.2% expansion) to $1457 (100% expansion) helps to rule out the threat of a Head-and-Shoulders formation as the former-resistance zone appears to be acting as support.
- Recent developments in the RSI foreshadow a potential change in market behavior as the oscillator breaks out of the bearish formation from earlier this year.
- However, gold appears to be stuck in the November range, with a move above $1489 (23.6% retracement) bringing last month’s high ($1516) on the radar.
- Need a break/close above the $1509 (61.8% retracement) to $1517 (78.6% expansion) region to bring the topside targets on the radar, with the first hurdle coming in around $1554 (100% expansion), which largely lines up with the yearly-high ($1557).
For more in-depth analysis, check out the 4Q 2019 Forecast for Gold
Additional Trading Resources
Are you looking to improve your trading approach? Review the ‘Traits of a Successful Trader’ series on how to effectively use leverage along with other best practices that any trader can follow.
Want to know what other currency pairs the DailyFX team is watching? Download and review the Top Trading Opportunities for 2019.
--- Written by David Song, Currency Strategist
Follow me on Twitter at @DavidJSong.


