


Gold Price Talking Points
The price of gold consolidates as the Trump administration and China appear to be on track to sign Phase One of the trade deal, but the ongoing shift in US trade policy may sway the near-term outlook for bullion as the Federal Reserve reiterates that monetary policy “is not on a preset course.”
Gold Price Holds Support Zone as Trump Negotiates Phase Two Trade Deal
Gold gives back the reaction to the Federal Open Market Committee (FOMC) interest rate decision, with the price for bullion pulling back from the monthly high ($1487) as President Donald Trump tweets that the administration “will begin negotiations on the Phase Two Deal immediately, rather than waiting until after the 2020 election.”
The agreement instills an improved outlook for global growth as “both sides have reached consensus that the US side will fulfill its commitments to phase out its additional tariffs on Chinese products,” and future developments may continue to sap the appeal of gold as it encourages the FOMC to retain the current policy for the foreseeable future.
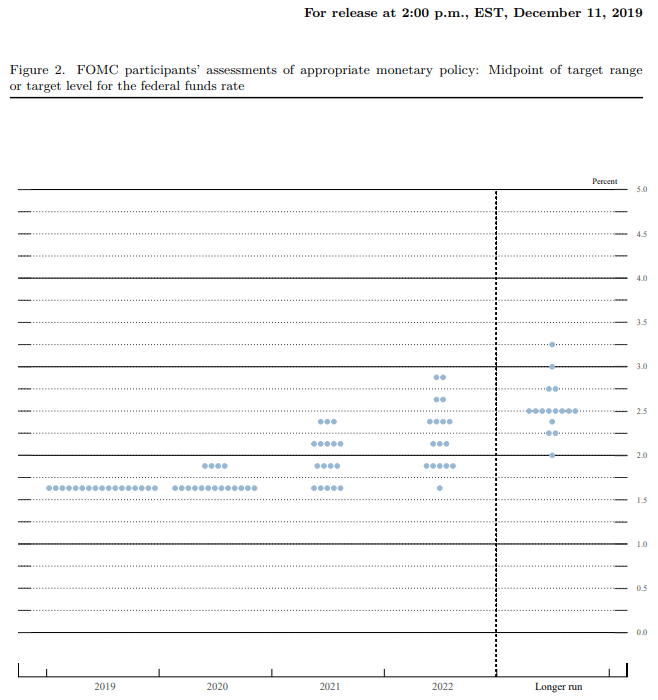
The update to the Fed’s Summary of Economic Projections (SEP) suggests the central bank will largely endorse a wait-and-see approach over the coming months as the dot-plot shows the benchmark interest rate sitting in its current threshold of 1.50% to 1.75% throughout 2020.
In turn, the FOMC may continue to tame speculation for lower interest rates at the next decision on January 29, but the central bank could be forced to alter the forward guidance in 2020 as Chairman Jerome Powell insists that “if developments emerge that cause a material reassessment of our outlook, we would respond accordingly.”
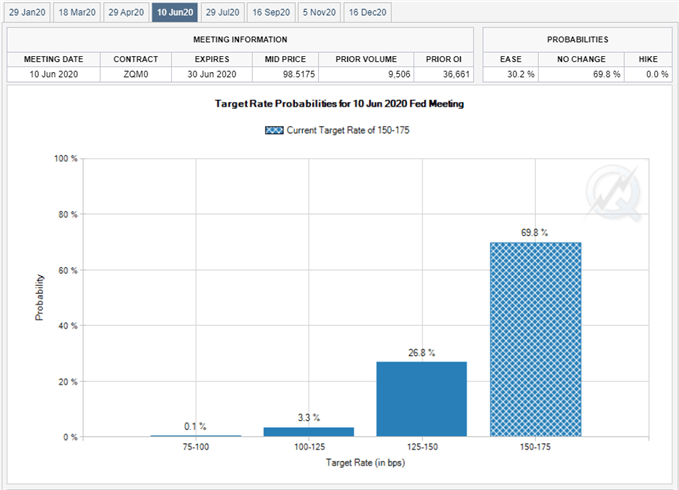
In fact, Fed Fund futures currently show a 30% probability for a rate cut in June 2020, and the FOMC may continue to respond to the shift in US trade policy as the Office of the United States Trade Representative (USTR) reveals that the Trump administration is “initiating a process to assess increasing the tariff rates and subjecting additional EU products to the tariffs.”
With that said, developments coming out of the US may continue to sway the price of gold, but the reaction to the former-resistance zone around $1447 (38.2% expansion) to $1457 (100% expansion) helps to rule out the threat of a Head-and-Shoulders formation as the region appears to be acting as support.
Sign up and join DailyFX Currency Strategist David Song LIVE for an opportunity to discuss potential trade setups.
Gold Price Daily Chart

Source: Trading View
- Keep in mind, the broader outlook for gold prices remain constructive as both price and the Relative Strength Index (RSI) clear the bearish trends from earlier this year, with the precious metal trading to a fresh yearly-high ($1557) in September.
- Moreover, the reaction to the Fibonacci overlap around $1447 (38.2% expansion) to $1457 (100% expansion) helps to rule out the threat of a Head-and-Shoulders formation as the former-resistance zone appears to be acting as support.
- However, the near-term correction in the price for gold has been accompanied by a bearish formation in the RSI, with the pattern offering a mixed signal as a bull flag formation also takes shape.
- In turn, gold may largely track the November range, with a move above $1489 (23.6% retracement) bringing last month’s high ($1516) on the radar.
- Need a break/close above the $1509 (61.8% retracement) to $1517 (78.6% expansion) region to bring the topside targets on the radar, with the first hurdle coming in around $1554 (100% expansion), which largely lines up with the yearly-high ($1557).
For more in-depth analysis, check out the 4Q 2019 Forecast for Gold
Additional Trading Resources
Are you looking to improve your trading approach? Review the ‘Traits of a Successful Trader’ series on how to effectively use leverage along with other best practices that any trader can follow.
Want to know what other currency pairs the DailyFX team is watching? Download and review the Top Trading Opportunities for 2019.
--- Written by David Song, Currency Strategist
Follow me on Twitter at @DavidJSong.


