


Gold Price Talking Points
The price of gold breaks out of the range-bound price action from the previous week amid waning hopes for a US-China trade deal, and the precious metal appears to be on track to test the November high ($1516) as the former-resistance zone around $1447 (38.2% expansion) to $1457 (100% expansion) offers support.
Gold Price Eyes November High with US on Track to Raise China Tariffs
The price of gold initiates a series of higher highs and lows as US President Donald Trump states that “I like the idea of waiting until after the election for the China deal,” with the Commander in Chief going onto say that “if it’s not going to be a good deal, I’m not signing a deal.”
The comments come as the Office of the United States Trade Representative (USTR) announces that the Trump administration is “initiating a process to assess increasing the tariff rates and subjecting additional EU products to the tariffs.”
With that said, hopes for a US-China trade deal may quickly fade as the Trump administration plans to implement additional tariffs on December 15, and growing tensions with the European Union (EU) may heighten the appeal of gold as it puts pressure on the Federal Reserve to further insulate the US economy.
The ongoing shift in US trade policy may force the Federal Reserve to implement lower interest rates as “weakness in global growth and trade developments have weighed on the economy and pose ongoing risks.”
In turn, the Federal Open Market Committee (FOMC) may reestablish its rate easing cycle in 2020, but the central bank appears to be on track to retain the current policy at the last meeting for 2019 as Chairman Jerome Powell and Co. see “the current stance of monetary policy as likely to remain appropriate as long as incoming information about the economy remains broadly consistent with our outlook of moderate economic growth.”
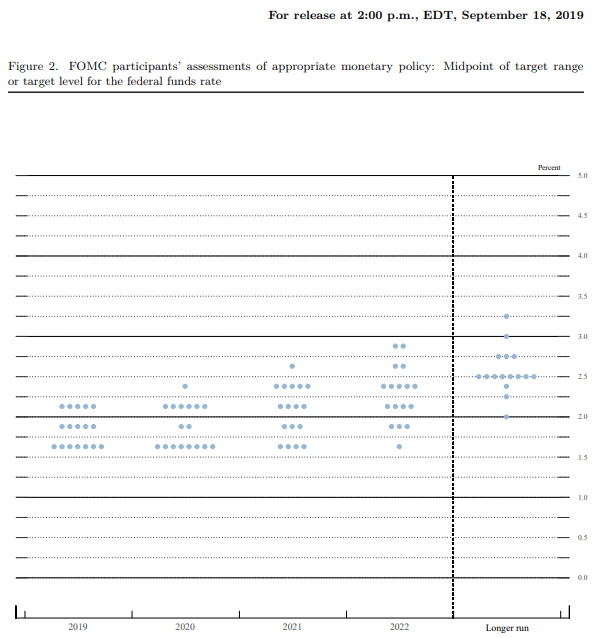
It remains to be seen if the Fed will adjust the forward guidance for monetary policy when the central bank updates the Summary of Economic Projections (SEP), but another downward revision in the interest rate dot-plot may boost the price of gold as market participants look for a hedge against fiat currencies.
As a result, developments surrounding US trade policy may continue to influence the near-term outlook for gold prices, but the reaction to the former-resistance zone around $1447 (38.2% expansion) to $1457 (100% expansion) helps to rule out the threat of a Head-and-Shoulders formation as the region appears to be acting as support.
Sign up and join DailyFX Currency Strategist David Song LIVE for an opportunity to discuss potential trade setups.
Gold Price Daily Chart
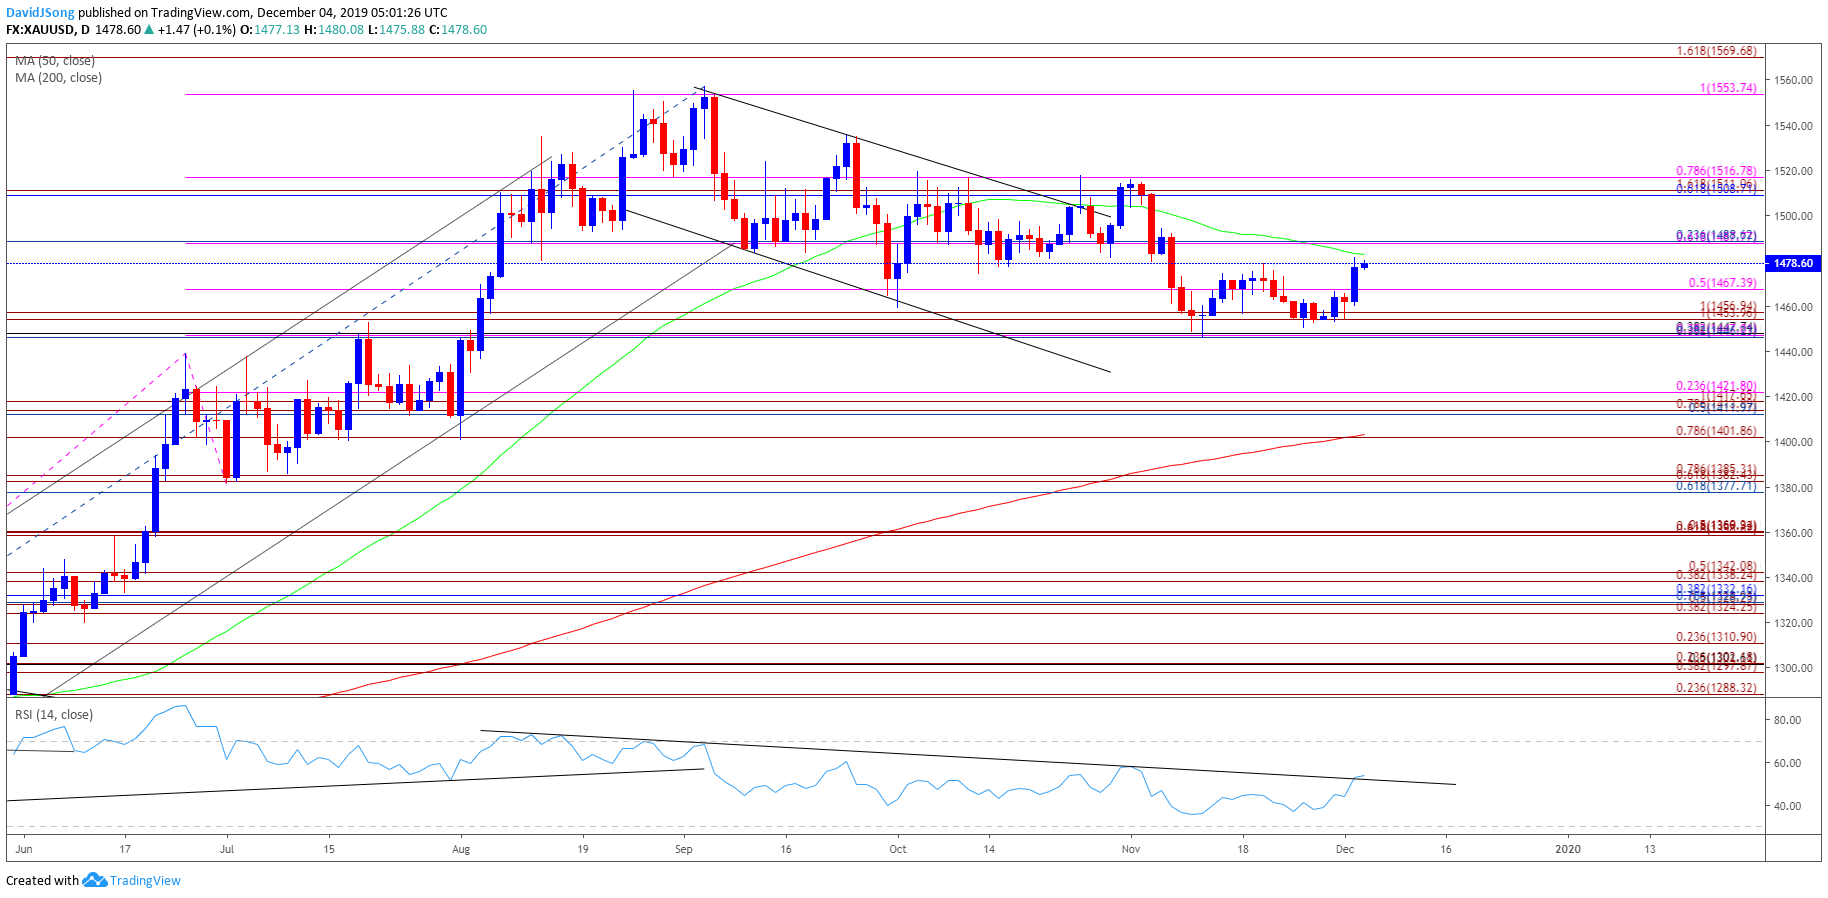
Source: Trading View
- Keep in mind, the broader outlook for gold prices remain constructive as both price and the Relative Strength Index (RSI) clear the bearish trends from earlier this year, with the precious metal trading to a fresh yearly-high ($1557) in September.
- Moreover, the reaction to the Fibonacci overlap around $1447 (38.2% expansion) to $1457 (100% expansion) helps to rule out the threat of a Head-and-Shoulders formation as the former-resistance zone appears to be acting as support.
- Will keep a close eye on the RSI as it appears to be threatening the downward trend carried over from August.
- In turn, the price of gold appears to be on track to test the November high ($1516) as it carves a fresh series of higher highs and lows, but need a break/close above the $1509 (61.8% retracement) to $1517 (78.6% expansion) region to bring the topside targets on the radar.
- First hurdle sits around $1554 (100% expansion), which largely lines up with the yearly-high ($1557), with the next area of interest coming in around $1570 (161.8% expansion).
For more in-depth analysis, check out the 4Q 2019 Forecast for Gold
Additional Trading Resources
Are you looking to improve your trading approach? Review the ‘Traits of a Successful Trader’ series on how to effectively use leverage along with other best practices that any trader can follow.
Want to know what other currency pairs the DailyFX team is watching? Download and review the Top Trading Opportunities for 2019.
--- Written by David Song, Currency Strategist
Follow me on Twitter at @DavidJSong.


