


Gold Price Talking Points
The price of gold approaches the monthly low ($1446) amid growing hopes for a US-China trade deal, but recent price action limits the downside risk for the precious metal as the former-resistance zone around $1447 (38.2% expansion) to $1457 (100% expansion) appears to be acting as support.
Gold Approaches Major Price Levels Amid Hopes for US-China Trade Deal
Headlines surrounding the US-China negotiation may continue to sway the price of gold as China’s Global Times reports that the two regions are ‘very close’ in finalizing phase one of the trade deal.
It remains to be seen if a major announcement will be made before the Trump administration implements additional tariffs on December 15 as China Foreign Ministry Spokesperson, Geng Shuang, continues to “hope the US will work with China to find a mutually acceptable solution based on equality and mutual respect, which will serve the interests of China, the US and beyond.”
Hopes for an imminent trade deal may quickly fade as President Donald Trump shows little intension of rolling back tariffs, and the ongoing shift in US trade policy may become a growing concern for the Federal Reserve as “weakness in global growth and trade developments have weighed on the economy and pose ongoing risks.”
Nevertheless, it seems as though the Federal Open Market Committee (FOMC) will take a break from its rate easing cycle as Chairman Jerome Powell tells US lawmakers that “the current stance of monetary policy as likely to remain appropriate as long as incoming information about the economy remains broadly consistent with our outlook of moderate economic growth.”
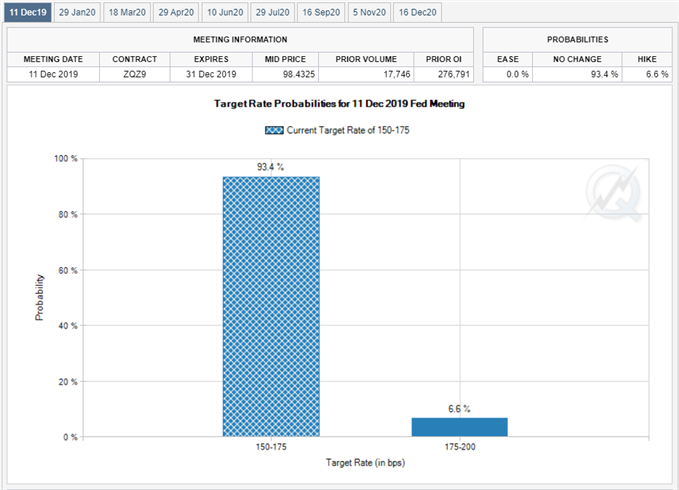
In turn, Fed Fund futures continue to reflect a greater than 90% probability the FOMC will keep the benchmark interest rate on hold at its last meeting for 2019, and a growing number of Fed officials may endorse a wait-and-see approach ahead of the next interest rate decision on December 11 as the central bank appears to be in no rush to reverse the four rate hikes from 2018.
However, the weakening outlook for the global growth may push Chairman Powell and Co. to further insulate the US economy in 2020 as the FOMC Minutes revealed that “many participants continued to view the downside risks surrounding the economic outlook as elevated.”
As a result, the Fed may continue to adjust the forward guidance for monetary policy when the central bank updates the Summary of Economic Projections (SEP) in December, and another downward revision in the interest rate dot-plot may heighten the appeal of gold as market participants look for a hedge against fiat currencies.
With that said, headlines surrounding the US-China trade negotiations may continue to influence the near-term outlook for gold prices, but the reaction to the former-resistance zone around $1447 (38.2% expansion) to $1457 (100% expansion) helps to rule out the threat of a Head-and-Shoulders formation as the region appears to be acting as support.
Sign up and join DailyFX Currency Strategist David Song LIVE for an opportunity to discuss potential trade setups.
Gold Price Daily Chart

Source: Trading View
- Keep in mind, the broader outlook for gold prices remain constructive as both price and the Relative Strength Index (RSI) clear the bearish trends from earlier this year, with the precious metal trading to a fresh yearly-high ($1557) in September.
- However, the near-term correction in the price for gold has been accompanied by a bearish formation in the RSI, with the pattern offering a mixed signal as a bull flag formation also takes shape.
- With that said, the reaction to the Fibonacci overlap around $1447 (38.2% expansion) to $1457 (100% expansion) helps to rule out the threat of a Head-and-Shoulders formation as the former-resistance zone appears to be acting as support.
- May see a similar scenario materialize over the coming days as the price of gold approaches the monthly low ($1446).
- Need a break/close above the $1509 (61.8% retracement) to $1517 (78.6% expansion) region to bring the topside targets on the radar, with the first topside hurdle comes in around $1554 (100% expansion), which largely lines up with the yearly-high ($1557).
For more in-depth analysis, check out the 4Q 2019 Forecast for Gold
Additional Trading Resources
Are you looking to improve your trading approach? Review the ‘Traits of a Successful Trader’ series on how to effectively use leverage along with other best practices that any trader can follow.
Want to know what other currency pairs the DailyFX team is watching? Download and review the Top Trading Opportunities for 2019.
--- Written by David Song, Currency Strategist
Follow me on Twitter at @DavidJSong.


