


US DOLLAR CURRENCY VOLATILITY RECEDES WITH FED IN REARVIEW
- USD price action continues to fluctuate within its recent range due to conflicting messages out of the September Fed meeting
- US Dollar implied volatility drifts lower as forex traders no longer face daunting event risk from this week’s loaded central bank decisions
- Check out this insight on How to Trade the Most Volatile Currency Pairs
The US Dollar whipsawed around the September Fed meeting and remains little changed over the last two weeks as forex traders battle over the world reserve currency’s next direction. Despite significant turbulence, USD price action has lacked conviction and is a theme that may continue over the short-term owing to ambiguous guidance on the Fed’s balance sheet from Chair Powell. With the immediate threat of a FOMC rate review now behind us, however, US Dollar implied volatility has since ebbed as markets no longer fret the staggering uncertainty brought about by looming central bank decisions.
US DOLLAR IMPLIED VOLATILITY & TRADING RANGES (1-WEEK)
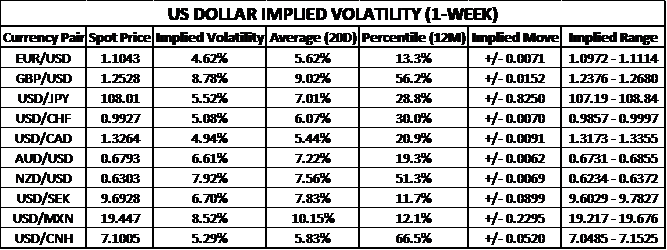
Aside from GBPUSD implied volatility remaining elevated driven by ongoing Brexit drama, USDCNH implied volatility appears relatively high. Watching the Chinese Yuan as a US-China Trade War gauge – especially the direction of spot USDCNH – could foreshadow the broad direction of the greenback as it reflects the market’s perception of Sino-American trade relations. On that note, negotiations between Washington and Beijing are set to resume this week, which follows the recent thawing of US-China trade tensions.
A significant spike higher in spot USDCNH likely indicates that the trade war between the world’s top economic powerhouses is escalating. This could foreshadow additional Fed easing down the road as the US central bank aims to mitigate downside risks and achieve its dual mandate of price stability and full employment. After all, Chair Powell did state the Fed’s commitment to sustaining the economic expansion. In turn, this may bode ill for the US Dollar more broadly.
US DOLLAR RISK REVERSALS (1-WEEK)
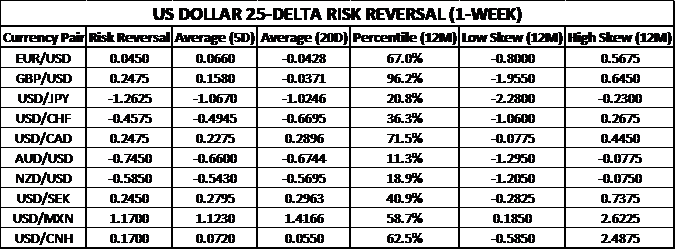
Generally speaking, there appears to be a general downside bias for the greenback when taking a look at 1-week US Dollar risk reversals. Although, AUDUSD seems to be one exception as Australian Dollar Upside Turns Sluggish. A risk reversal reading above zero indicates that the demand for call option volatility (upside protection) exceeds that of put option volatility (downside protection).
DXY INDEX – US DOLLAR PRICE CHART: DAILY TIME FRAME (APRIL 16, 2019 TO SEPTEMBER 19, 2019)
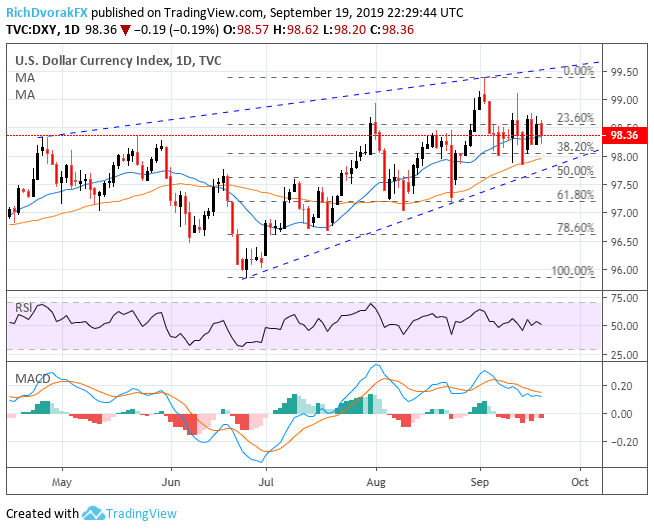
Chart created by @RichDvorakFX with TradingView
We have noted in our daily US Dollar price volatility report that the DXY Index continues to fluctuate around its 20-DMA, which still seems to be the case. USD price action has largely drifted sideways with technical resistance around the 98.50-98.75 level and support around the 98.00-98.25 area. Although, the bullish trendline from the stretch of higher lows since late June and upward sloping 50-DMA are both coming into scope with potential to keep the US Dollar afloat going forward.
-- Written by Rich Dvorak, Junior Analyst for DailyFX.com
Connect with @RichDvorakFX on Twitter for real-time market insight


