


Gold Price Talking Points
The recent decline in the price of gold appears to have stalled following the Federal Reserve Minutes, but fresh developments in the Relative Strength Index (RSI) offer a bearish signal as the oscillator threatens the upward trend carried over from the previous month.
Gold Price Forecast: RSI Offers Bearish Signal Following FOMC Minutes
Gold holds above the monthly-low ($1266) as the Federal Open Market Committee (FOMC) Minutes spur a limited reaction, but the wait-and-see approach for monetary policy may continue to drag on the price for bullion as the central bank shows little to no interest in altering the forward-guidance for monetary policy.
It seems as though the FOMC will stick to the sidelines at the next interest rate decision on June 19 as the committee insists that ‘the first-quarter softness in household spending was likely to prove temporary,’ and the central bank appears to be in no rush to abandon the hiking-cycle as ‘a few participants noted that if the economy evolved as they expected, the Committee would likely need to firm the stance of monetary policy to sustain the economic expansion and keep inflation at levels consistent with the Committee's objective.’
Moreover, the FOMC may do little to offset the ongoing shift in U.S. trade policy as the central bank notes that the ‘prospects for a sharp slowdown in global economic growth, particularly in China and Europe, had diminished,’ and Fed officials may continue to emphasize that ‘their monetary policy decisions would continue to depend on their assessments of the economic outlook and risks to the outlook, as informed by a wide range of data’ as the economy shows no signs of an imminent recession.
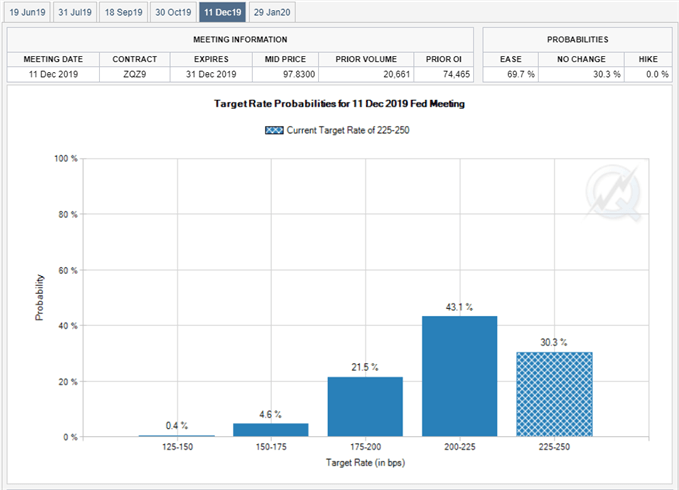
With that said, it remains to be seen if Chairman Jerome Powell & Co. will continue to project a longer-run interest rate of 2.50% to 2.75% as Fed Fund Futures still reflect a greater than 60% probability for a December rate-cut, and more of the same from the FOMC may produce headwinds for gold as it dampens bets for a change in regime.
Keep in mind, there appears to be a broader shift in market behavior as the price for bullion snaps the opening range for 2019, and the precious metal may continue to give back the advance from the 2018-low ($1160) as a head-and-shoulders formation remains in play.
Sign up and join DailyFX Currency Strategist David Song LIVE for an opportunity to discuss key themes and potential trade setups surrounding foreign exchange markets.
Gold Price Daily Chart
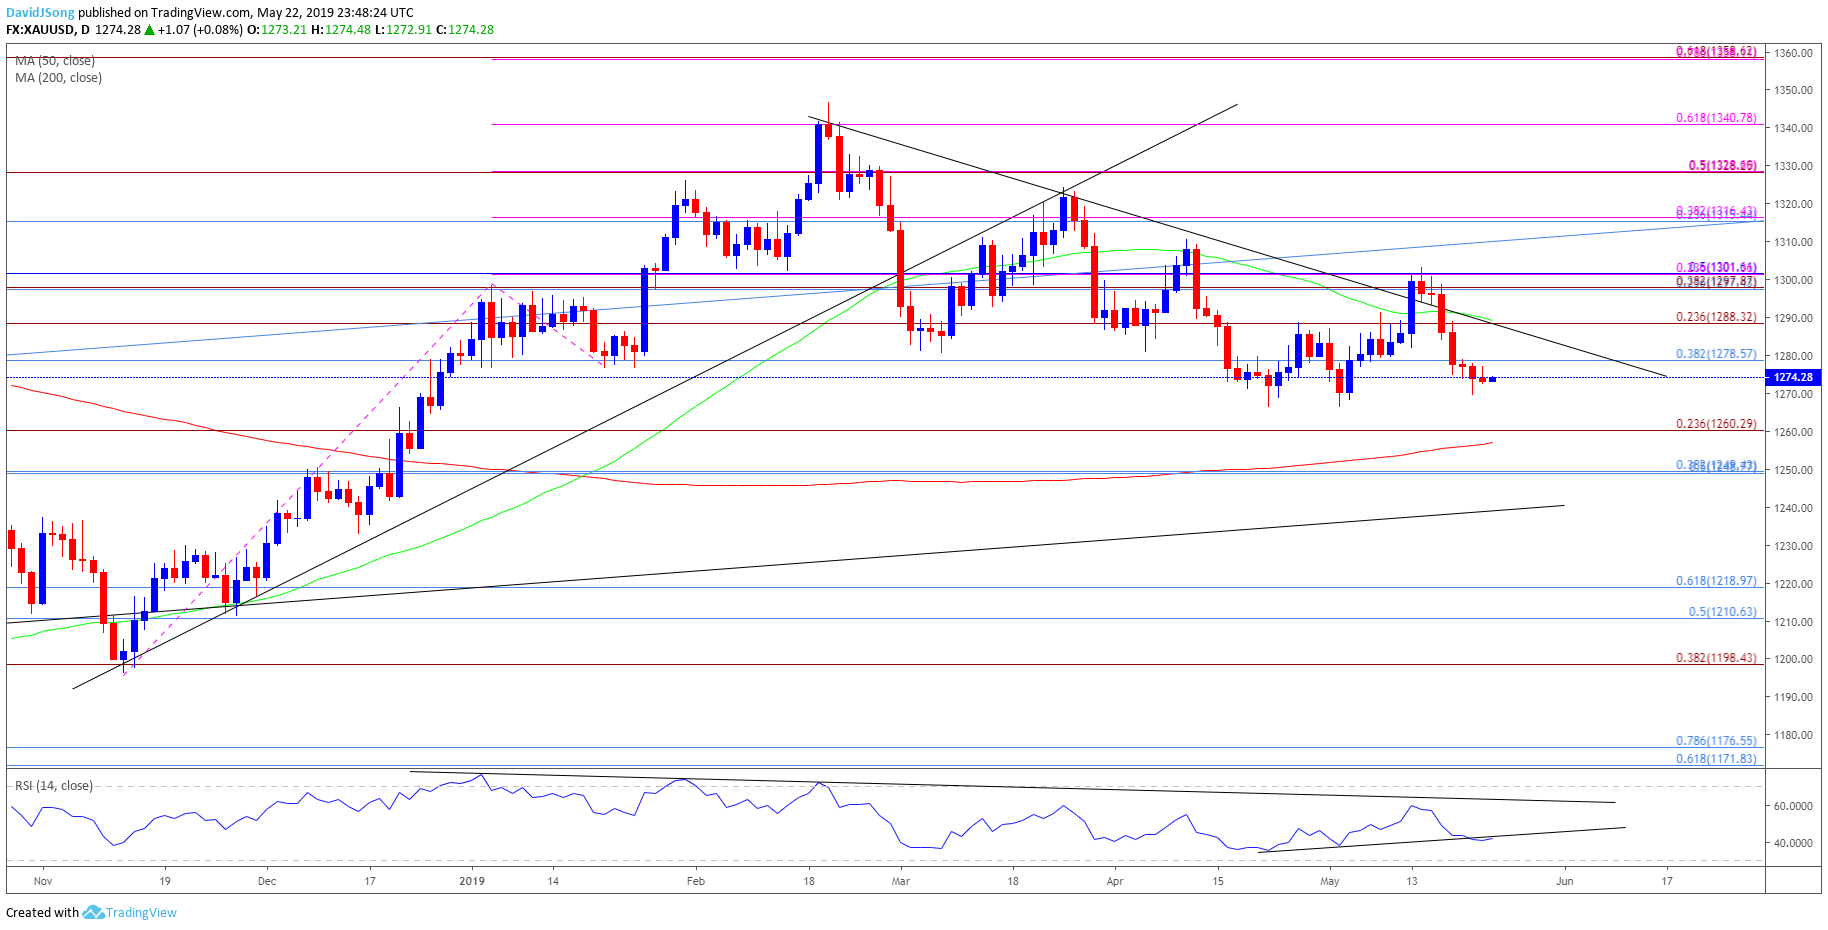
- The broader outlook for gold remains mired by the head-and-shoulders formation amid the break of neckline support, with the Relative Strength Index (RSI) highlighting a similar dynamic as it tracks the bearish trends from earlier this year.
- Downside targets are coming back on the radar following the failed attempt to break/close above the Fibonacci overlap around $1298 (23.6% retracement) to $1302 (50% retracement), with RSI also highlighting a bearish signal as the oscillator threatens the upward trend carried over from the previous month.
- In turn, lack of momentum to push back above the $1279 (38.2% retracement) pivot keeps the $1260 (23.6% expansion) region on the radar, with the next area of interest coming in around $1249 (50% retracement) to $1250 (38.2% retracement).
For more in-depth analysis, check out the 2Q 2019 Forecast for Gold
Additional Trading Resources
Are you looking to improve your trading approach? Review the ‘Traits of a Successful Trader’ series on how to effectively use leverage along with other best practices that any trader can follow.
Want to know what other markets the DailyFX team is watching? Download and review the Top Trading Opportunities for 2019.
--- Written by David Song, Currency Strategist
Follow me on Twitter at @DavidJSong.


