


Gold Price Talking Points
The price for gold struggles to extend the recent series of higher highs & lows ahead of the Federal Reserve meeting, and there appears to be a broader shift in market behavior as a head-and-shoulders formation starts to unfold.
Gold Price Forecast: Bearish Formations Remain in Play Ahead of FOMC
Attention turns to the Federal Open Market Committee (FOMC) interest rate decision on May 1 as Chairman Jerome Powell is scheduled to host a press conference following the announcement, and it seems as though the central bank is in no rush to alter the forward-guidance as ‘a majority of participants expected that the evolution of the economic outlook and risks to the outlook would likely warrant leaving the target range unchanged for the remainder of the year.’
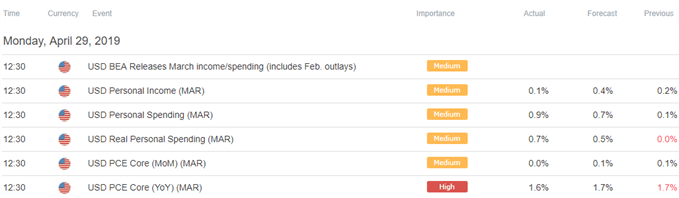
In fact, the updates to the U.S. Gross Domestic Product (GDP) report may keep the FOMC on the sidelines as it instills a mixed outlook for the economy, and signs of below-target inflation may encourage Fed officials to endorse a wait-and-see approach for monetary policy as the gauge for Personal Income increases 0.1% in March after expanding 0.2% the month prior, while the core Personal Consumption Expenditure Deflator unexpectedly narrows to 1.6% from 1.7% per annum during the same period.
With that said, market participants may look for a flurry of dovish comments from Chairman Powell especially as the FOMC plans to wind down the $50B/month in quantitative tightening (QT) starting in May, but little to no evidence of a looming recession may push the central bank to buy more time as ‘some participants indicated that if the economy evolved as they currently expected, with economic growth above its longer-run trend rate, they would likely judge it appropriate to raise the target range for the federal funds rate modestly later this year.’
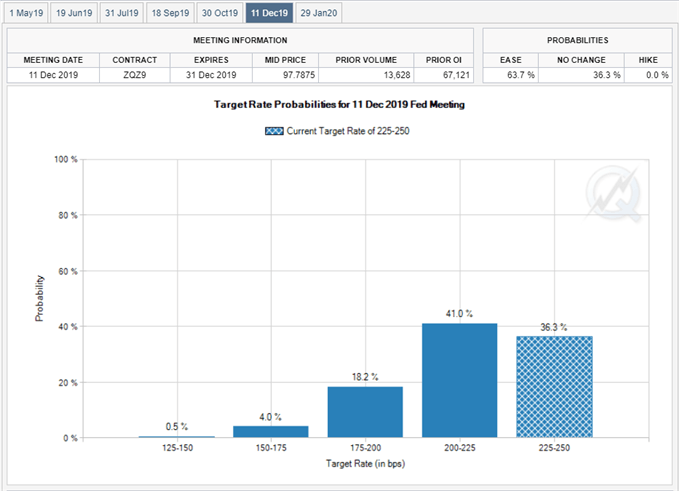
It remains to be seen if Chairman Powell & Co. will continue to project a longer-run interest rate of 2.50% to 2.75% at the next quarterly meeting in June as Fed Fund Futures continue to reflect a greater than 60% probability for a December rate-cut, and the lack of urgency to alter the forward-guidance for monetary policy may continue to drag on the price for gold as it raises the scope for higher U.S. interest rates.
Keep in mind, recent developments surrounding gold warn of a broader shift in market behavior as the price for bullion snaps the yearly opening range, and the precious metal may continue to give back the advance from the 2018-low ($1160) as a head-and-shoulders formation starts to unfold.
Sign up and join DailyFX Currency Strategist David Song LIVE for an opportunity to discuss potential trade setups.
Gold Price Daily Chart
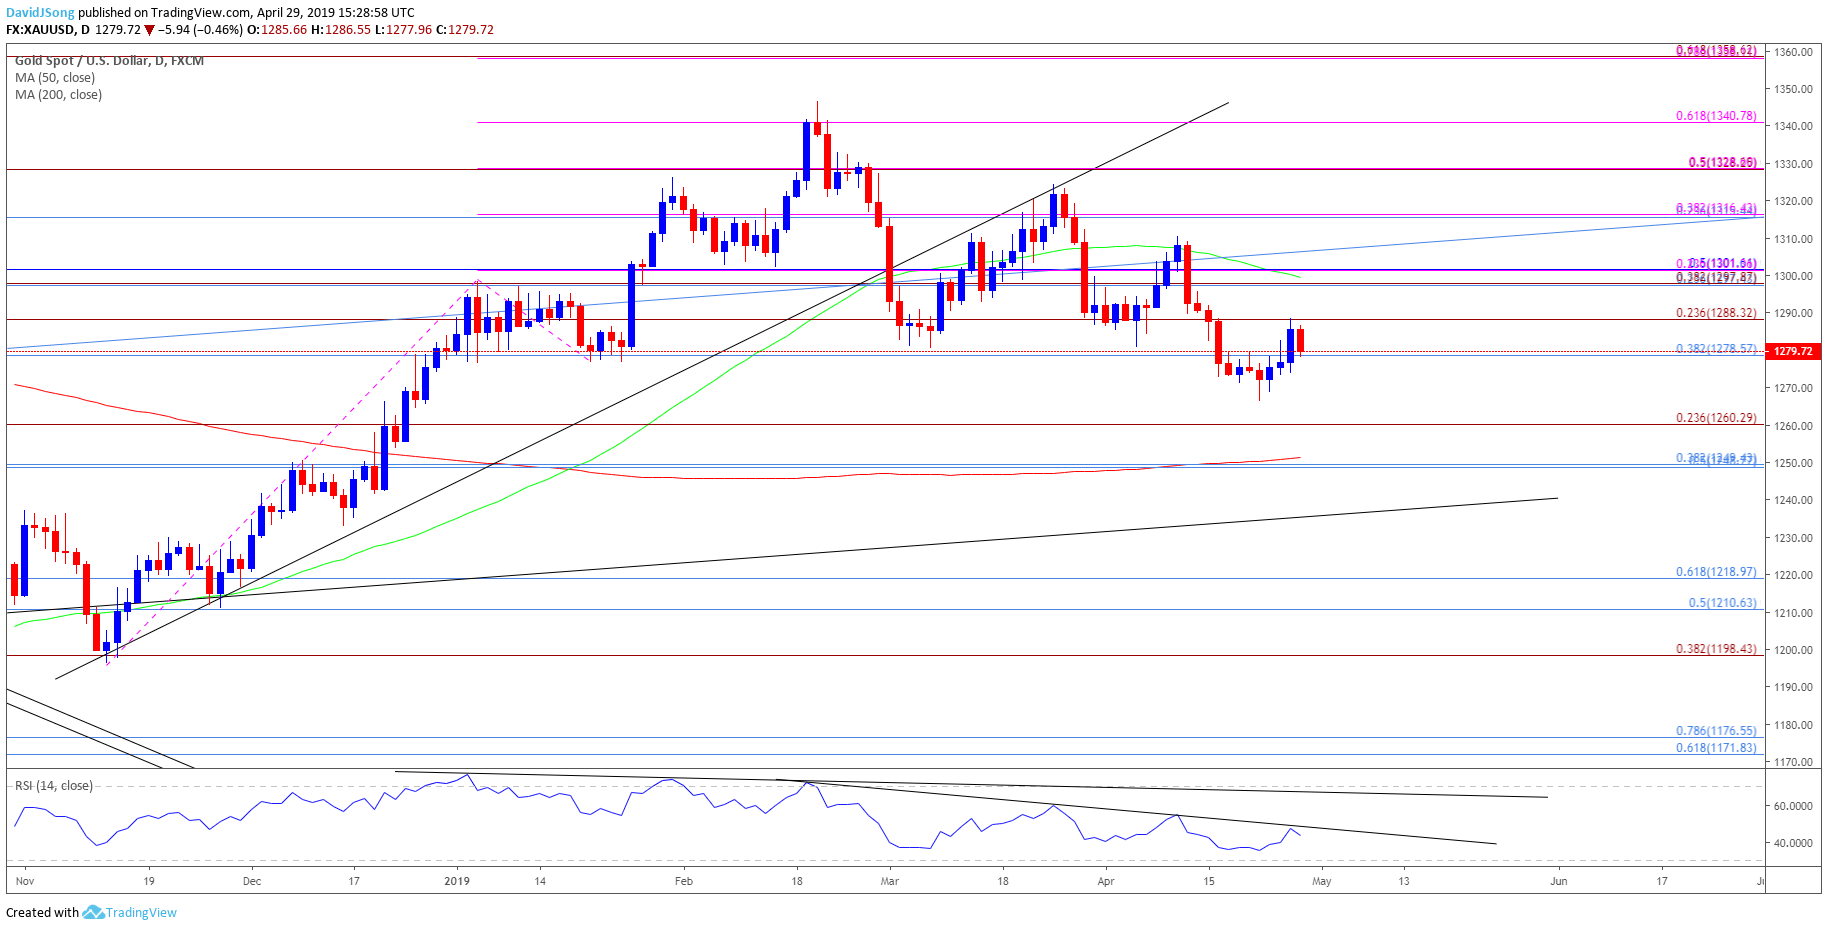
- The broader outlook for gold remains mired by the head-and-shoulders formation amid the break of neckline support, with the Relative Strength Index (RSI) highlighting a similar dynamic as it tracks the bearish trends from earlier this year.
- Even though the price for bullion trades back above the former-support zone around $1279 (38.2% retracement), failure to preserve the yearly opening range brings the downside targets on the radar, with the first area of interest coming in around $1260 (23.6% expansion).
- Next region of interest comes in around $1249 (50% retracement) to $1250 (38.2% retracement), which lines up with the 200-Day SMA ($1251).
For more in-depth analysis, check out the 2Q 2019 Forecast for Gold
Additional Trading Resources
Are you looking to improve your trading approach? Review the ‘Traits of a Successful Trader’ series on how to effectively use leverage along with other best practices that any trader can follow.
Want to know what other markets the DailyFX team is watching? Download and review the Top Trading Opportunities for 2019.
--- Written by David Song, Currency Strategist
Follow me on Twitter at @DavidJSong.


