


Gold Talking Points
Gold rebounds from a fresh monthly-low following the 1.2% contraction in U.S. Retail Sales, and recent price action brings the 2019-high ($1326) on the radar as a bull-flag formation appears to be unfolding.
Gold Prices Eye 2019-High as Bull-Flag Formation Unfolds
Developments coming out of the world’s largest economy may continue to heighten the appeal of bullion as Industrial Production unexpectedly contracts 0.6% in January, while the U. of Michigan Confidence survey shows 12-month inflation expectations narrowing to 2.5% from 2.7% per annum in January even though the gauge for household sentiment climbs to 95.5 from 91.2 during the same period.
In response, a growing number of Federal Reserve officials are likely to endorse a wait-and-see approach for monetary policy as Governor Lael Brainardargues that the central bank is ‘in a very good place to watch
and see that data as it comes in,’ and it seems as though the Federal Open Market Committee (FOMC) will continue to alter the forward-guidance for monetary policy as the permanent voting-member indicates that the ‘balance-sheet normalization process probably should come to an end later this year.’
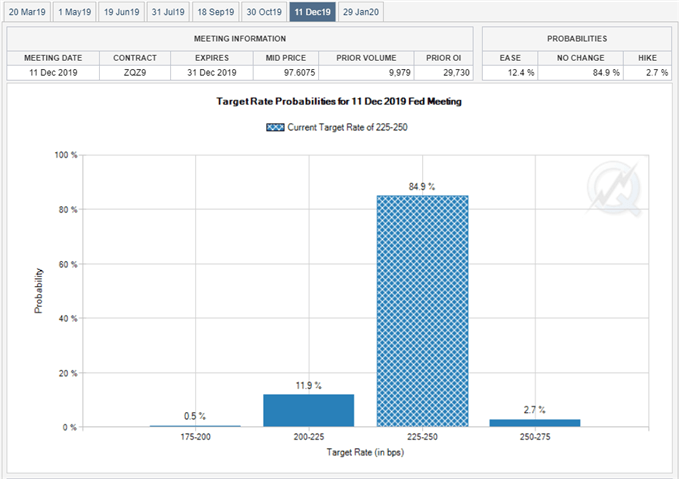
As a result, Fed Fund Futures may persistently show the FOMC on hold throughout 2019, and Chairman Jerome Powell & Co. may sounds more cautious ahead of the next meeting in March amid the ‘cross-currents’ surrounding the economic outlook.
In turn, waning expectations for higher U.S. interest rates should continue to heighten the appeal of gold, and the precious metal may stage a larger advance over the coming days as a bull-flag formation appears to panning out. Sign up and join DailyFX Currency Analyst David Song LIVE for an opportunity to discuss potential trade setups.
Gold Daily Chart
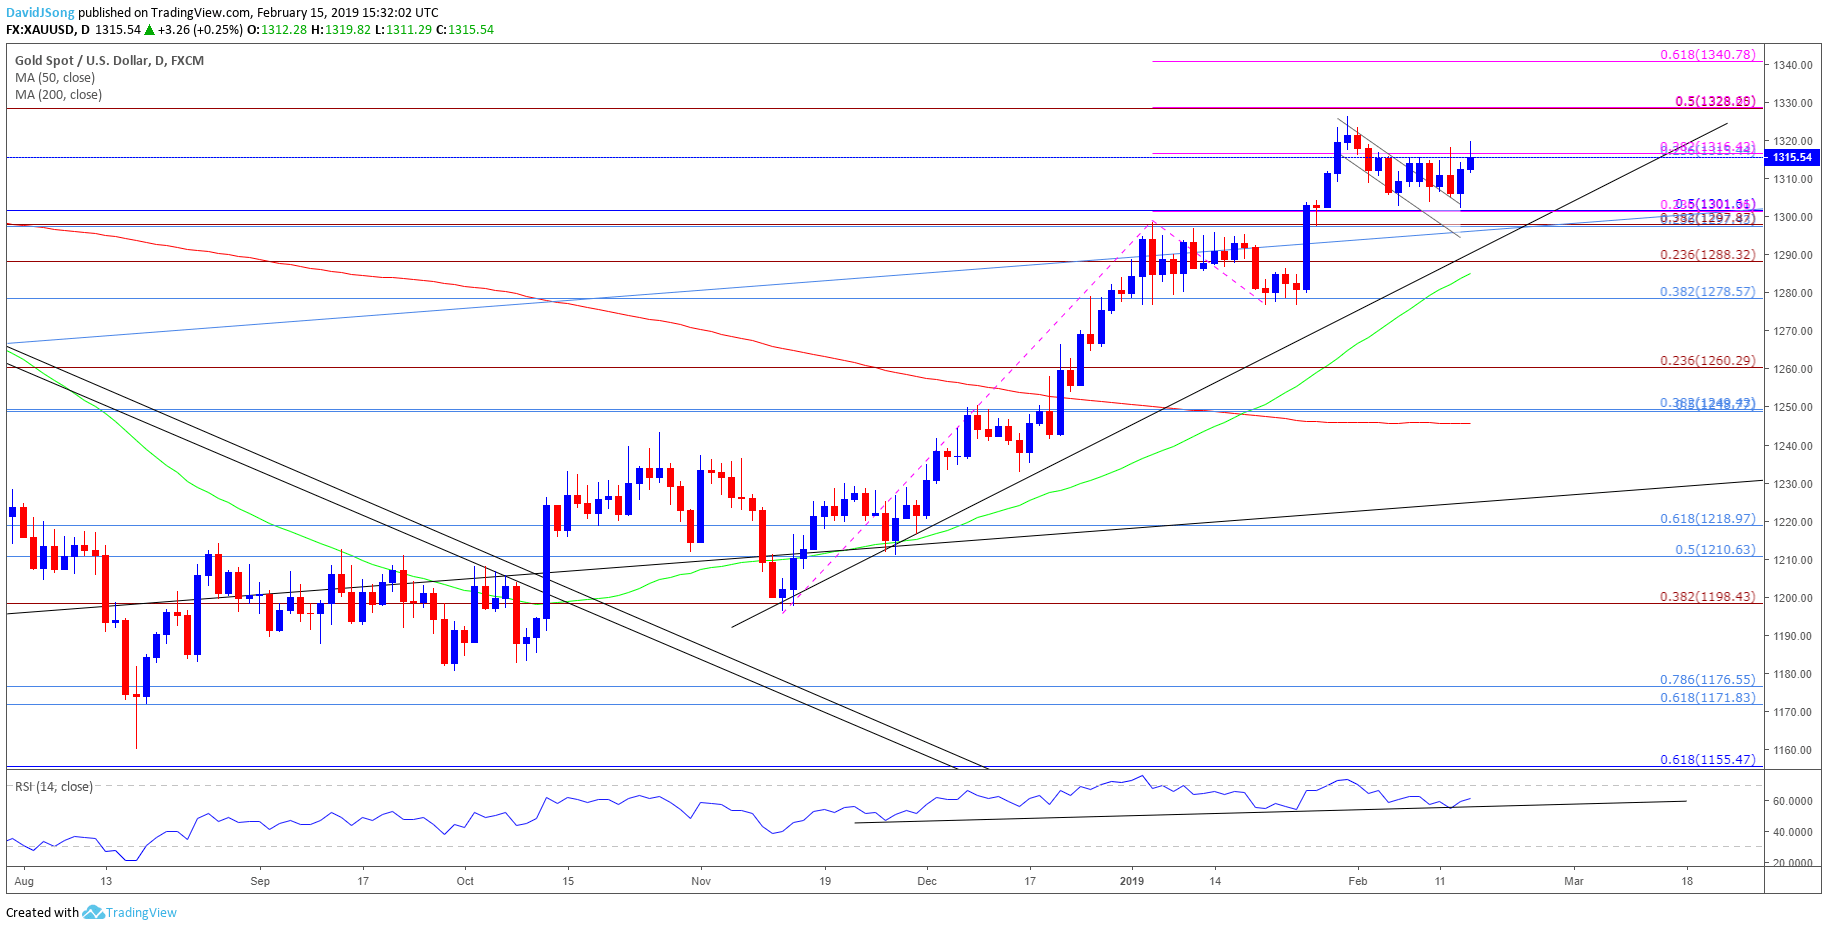
- The broader outlook for gold remains constructive as both price and the Relative Strength Index (RSI) track the bullish trends from late-2018, and a bull-flag formation appears to be unfolding as the former-resistance zone around $1298 (23.6% retracement) to $1302 (50% retracement) offers support.
- In turn, a close back above $1316 (23.6% retracement) raises the risk for a run at the 2019-high ($1326), but need a break/close above the $1328 (50% expansion) hurdle to bring the $1340 (61.8% expansion) region on the radar.
For more in-depth analysis, check out the 1Q 2019 Forecast for Gold
Additional Trading Resources
Are you looking to improve your trading approach? Review the ‘Traits of a Successful Trader’ series on how to effectively use leverage along with other best practices that any trader can follow.
Want to know what other markets the DailyFX team is watching? Download and review the Top Trading Opportunities for 2019.
--- Written by David Song, Currency Analyst
Follow me on Twitter at @DavidJSong.


