


Gold Talking Points
Gold trades within a narrow range as there appears to be a diminishing threat for a U.S.-China trade war, but recent price action keeps the topside targets on the radar as the Relative Strength Index (RSI) responds to the bullish formation carried over from late-2018.
Gold Prices Hold 2019 Opening Range, RSI Responds to Bullish Formation
The near-term advance in gold appears to have stalled ahead of the June-high ($1309) as U.S. President Donald Trump tweets that ‘talks with China are going very well,’ and the mild improvement in investor confidence may keep the precious metal under pressure as global equity prices extend the rebound from earlier this week.
In turn, a further pickup in risk-taking behavior may drag on the price for bullion especially as the People’s Bank of China (PBoC) appears to be on track to reduce the Reserve Requirement Ratio (RRR) ahead of the lunar New Year, but waning expectations for higher U.S. interest rates should keep the precious metal afloat as the ongoing stalemate in Congress clouds the outlook for growth and inflation.
A growing number of Federal Reserve officials appear to be scaling back their willingness to implement higher borrowing-costs as Atlanta Fed President Raphael Bostic warns a ‘prolonged shutdown would push back the types of growth the Fed has projected,’ and the Federal Open Market Committee (FOMC) may have little choice but to adopt a less-hawkish tone at the next interest rate decision on January 30 as the uncertainty surrounding fiscal policy puts pressure on the central bank to conclude the hiking-cycle ahead of schedule.
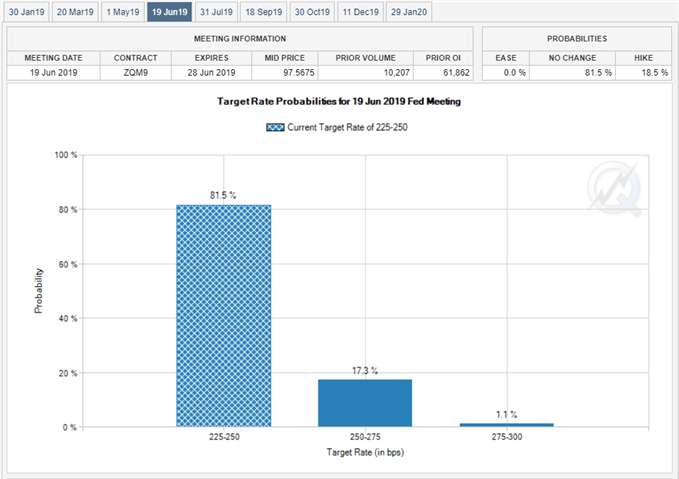
With that said, the current environment may continue to boost the appeal of gold as Fed Fund Futures still show Chairman Jerome Powell & Co. on hold throughout the first-half of 2019, but there appears to be a broader shift in retail sentiment as traders fade the stickiness in gold prices.

The IG Client Sentiment Report shows 69.5% of traders are now net-long gold compared 70.8% last week, with the ratio of traders long to short at 2.28 to 1. Moreover, the percentage of traders net-long is now its lowest since September 03 when gold traded near $1200.The number of traders net-long is 1.9% lower than yesterday and 4.2% lower from last week, while the number of traders net-short is 5.8% higher than yesterday and 16.1% higher from last week.
The range-bound price action appears to be prompting profit-taking behavior amid the drop in net-long interest, but the update also highlights a more dynamic shift in market sentiment as the retail crowd ramps its net-short exposure.
As a result, the change in the IG Client Sentiment index may continue to materialize alongside higher gold prices, with the topside targets still on the radar for the precious metal as the Relative Strength Index (RSI) appears to be responding to trendline support. Sign up and join DailyFX Currency Analyst David Song LIVE for an opportunity to discuss potential trade setups.
Gold Daily Chart
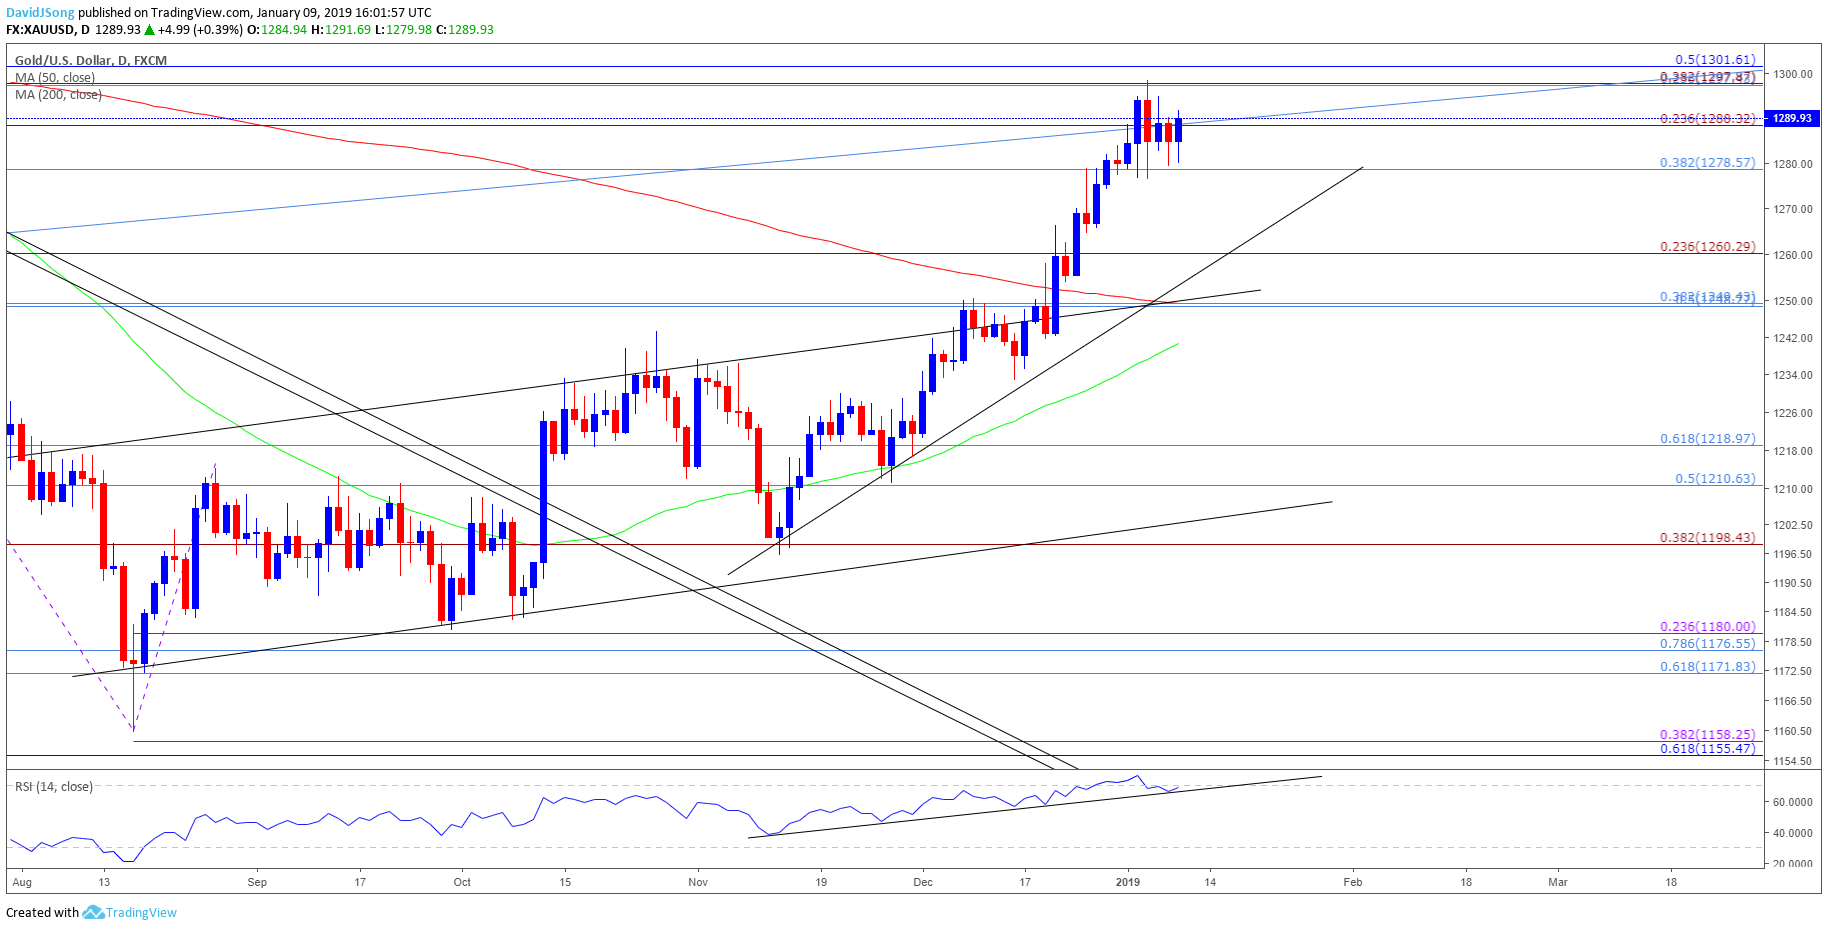
- Topside targets remain on the radar for gold as both price and RSI preserve the bullish formations from late-2018, but the precious metal seems to be stuck in a near-term holding pattern as it consolidates above the $1279 (38.2% retracement) region.
- Still waiting for a break/close above the $1298 (23.6% retracement) to $1302 (50% retracement) area to spur a more meaningful run at the June-high ($1309), with the next region of interest coming in around $1315 (23.6% retracement) followed by $1328 (50% expansion).
For more in-depth analysis, check out the 1Q 2019 Forecast for Gold
Additional Trading Resources
Are you looking to improve your trading approach? Review the ‘Traits of a Successful Trader’ series on how to effectively use leverage along with other best practices that any trader can follow.
Want to know what other markets the DailyFX team is watching? Download and review the Top Trading Opportunities for 2019.
--- Written by David Song, Currency Analyst
Follow me on Twitter at @DavidJSong.


