


Gold Talking Points
Gold pares the decline from the previous week to preserve the range-bound price action from September, but the current environment may continue to sap the appeal of the precious metal as the Federal Reserve appears to be on track to implement another rate-hike at the next quarterly meeting in December.
Gold Price Outlook Mired by Failure to Test August High
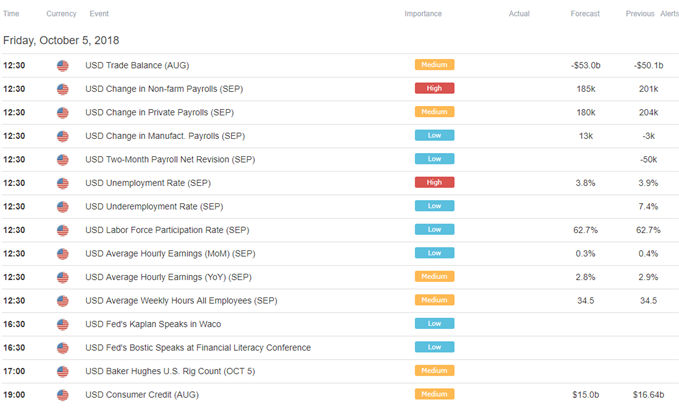
Gold trades on a firmer footing ahead of the U.S. Non-Farm Payrolls (NFP) report, with the precious metal tagging a weekly high of $1208, but the fresh updates coming out of the world’s largest economy may curb the recent rebound in bullion as employment is expected to increase another 184K in September.
The ongoing improvement in the labor market should keep the Federal Open Market Committee (FOMC) on track to move away from its accommodative stance as the central bank largely achieves its dual mandate for monetary policy, and Chairman Jerome Powell & Co. may continue to prepare U.S. households and businesses for higher borrowing-costs at the next rate decision on November 8 as ‘the economy is strong, unemployment is near 50-year lows, and inflation is roughly at our 2 percent objective.’
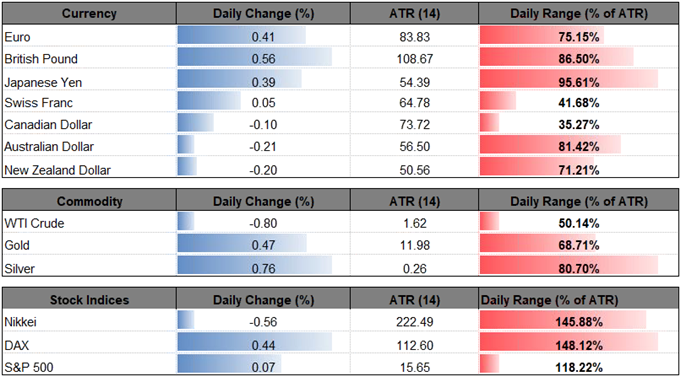
At the same time, there appears to be little to no signs of an imminent shift in risk appetite as U.S. equities trade near record-highs, and expectations for higher U.S. interest rates accompanied by higher stock prices may keep gold under pressure especially as retail interest remains heavily skewed, with the IG Client Sentiment Report showing 84.0% of traders net-long bullion.

The ratio of traders long to short stands at 5.27 to 1 as the number of traders net-long is 9.8% higher than yesterday and 3.1% lower from last week, while the number of traders net-short is 15.2% lower than yesterday and 21.3% higher from last week. The ongoing slant in retail positioning offers a contrarian view to crowd sentiment, with the string of failed attempts to test the August-high ($1225) fostering a bearish outlook for bullion as both price and the Relative Strength Index (RSI) snap the bullish formations carried over from the same period. Sign up and join DailyFX Currency Analyst David Song LIVE for an opportunity to discuss potential trade setups.
Gold Daily Chart
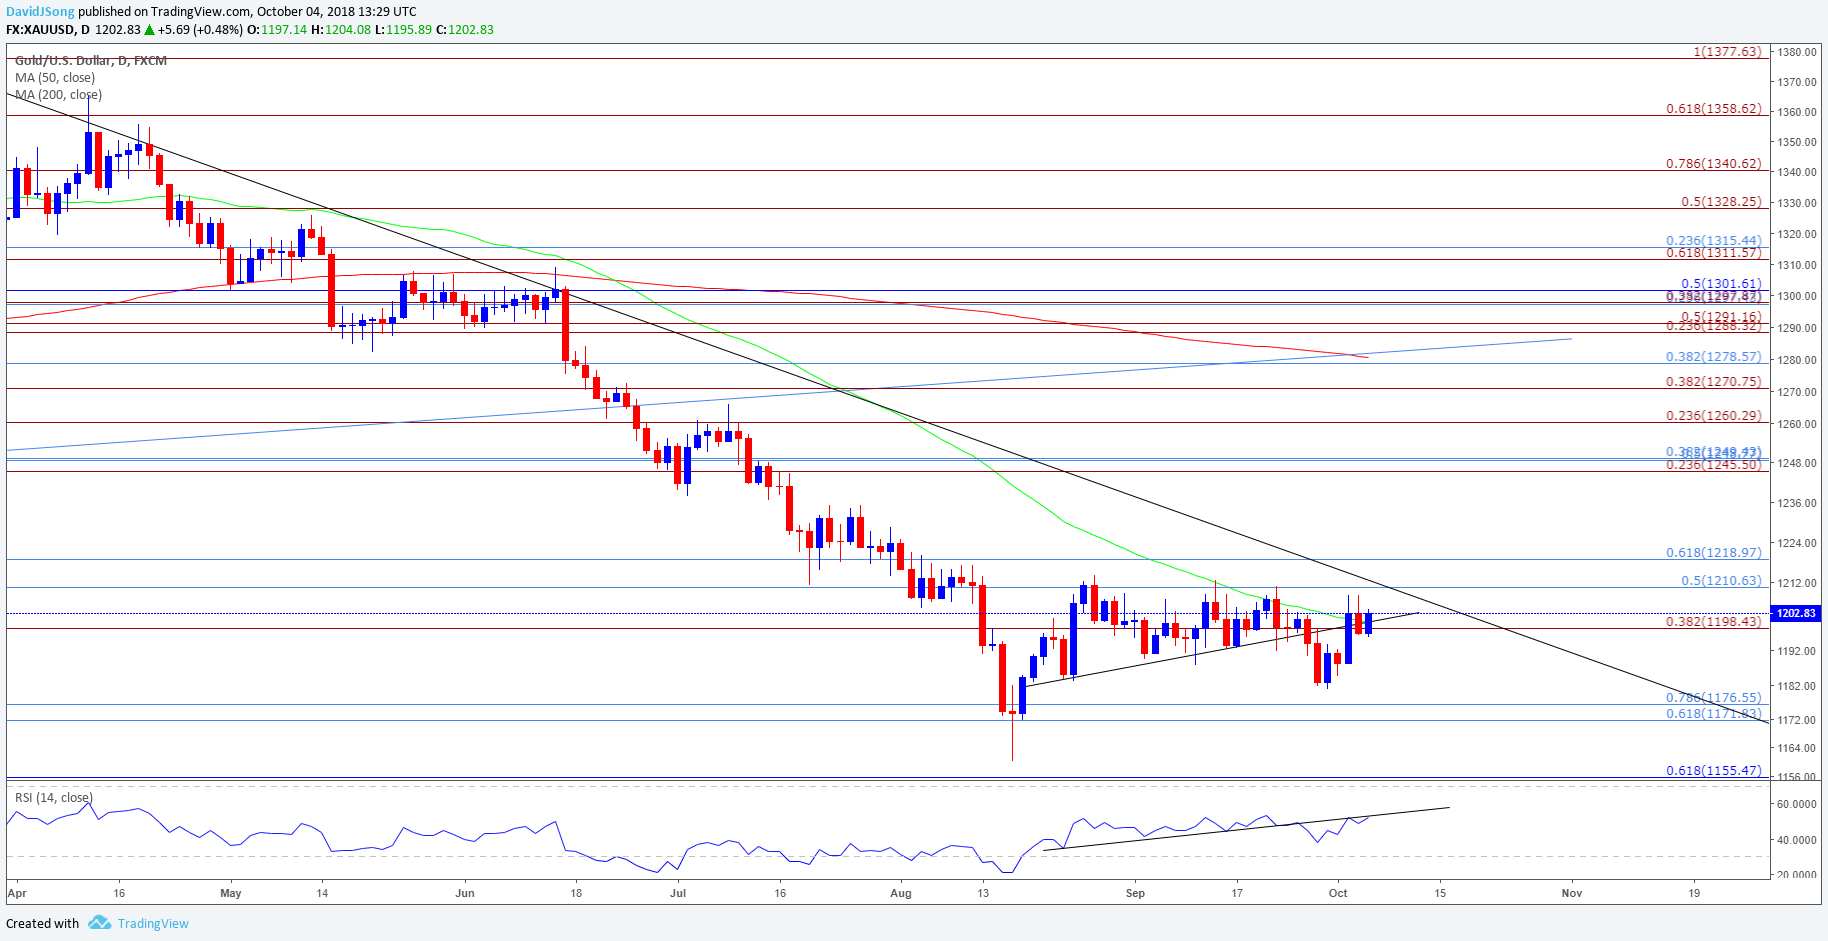
- Failure to push back above the $1210 (50% retracement) to $1219 (61.8% retracement) region may bring the downside targets back on the radar, with first area of interest coming in around $1172 (61.8% retracement) to $1177 (78.6% retracement).
- Need a break/close below the Fibonacci overlap to bring up the 2018-low ($1160), which sits just above the $1156 (61.8% retracement) hurdle.
For more in-depth analysis, check out the Q4 Forecast for Gold
Additional Trading Resources
Are you looking to improve your trading approach? Review the ‘Traits of a Successful Trader’ series on how to effectively use leverage along with other best practices that any trader can follow.
Want to know what other currency pairs the DailyFX team is watching? Download and review the Top Trading Opportunities for 2018.
--- Written by David Song, Currency Analyst
Follow me on Twitter at @DavidJSong.


