


Oil Talking Points
Oil prices may exhibit a more bullish behavior over the coming days as the Organization of the Petroleum Exporting Countries (OPEC) and its allies emphasize their commitment in rebalancing the energy market, and crude may continue to retrace the decline from the July-high ($75.24) as it appears to be on track to threaten the range bound price action carried over from the previous month.
Crude Forecast: Bullish RSI Trigger to Fuel Higher Oil Prices
Even though Rosneft PJSC, Russia’s largest oil producer, stands ready to boost crude output, fresh remarks from Energy Minister Alexander Novak suggest the region will uphold the agreement from OPEC’s 174th meeting as ‘future production levels will depend on meeting this goal.’
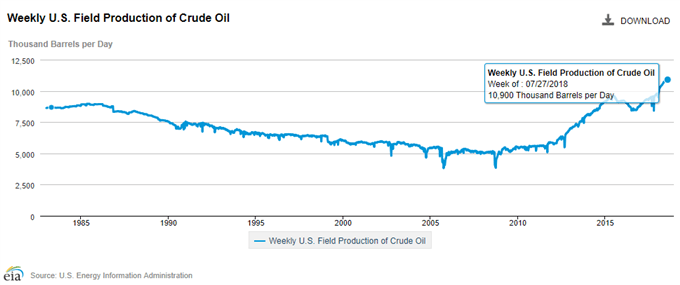
Despite the renewed sanctions on Iran, it seems as though OPEC and its allies will continue to carry out the production-cutting measures as crude output in the United States climbs to record-highs. The ongoing supply-side adjustment keeps the broader outlook tilted to the topside as the group appears to be on track to retain the extraordinary measures throughout 2018, with the economic crisis in Venezuela also likely to attribute to higher oil prices as it curbs the outlook for supply.
With that said, the broader outlook for oil remains constructive as both price and the Relative Strength Index (RSI) retain the upward trends from earlier this year, with the momentum indicator on the cusp of flashing a bullish signal as it comes up against trendline resistance.
Oil Daily Chart
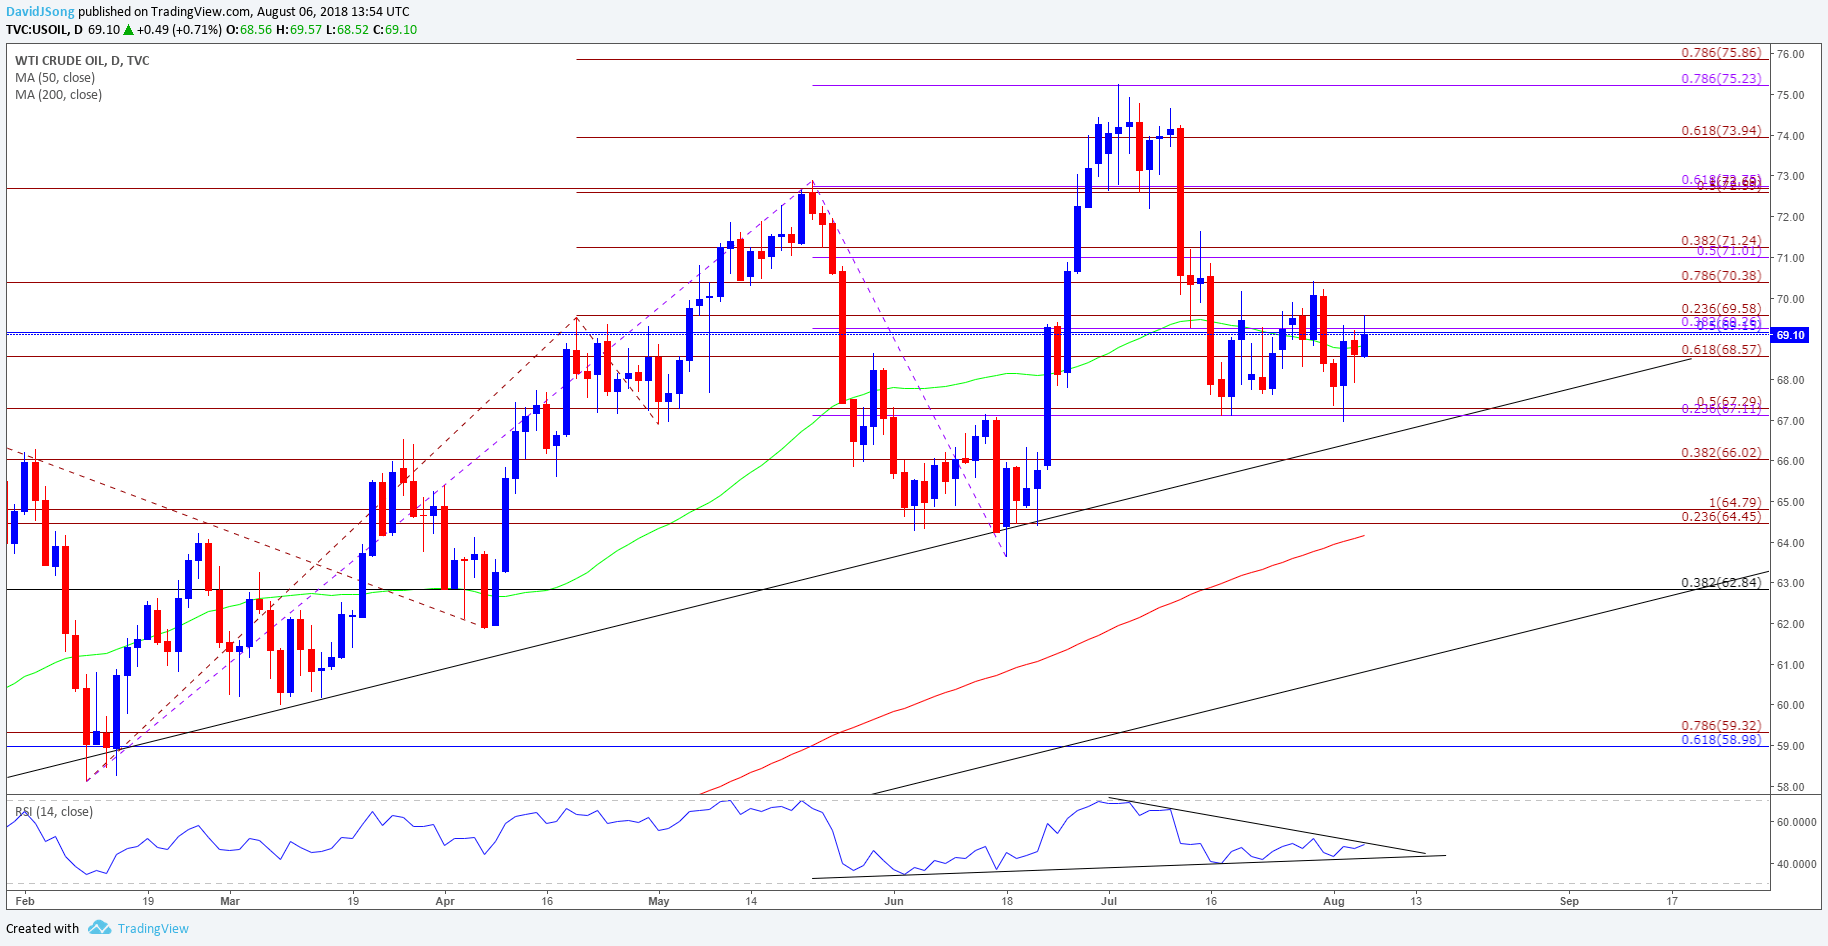
- Keeping a close eye on the monthly opening range as oil bounces back from last week’s low ($66.95) following the failed attempt to close below the $67.10 (23.6% expansion) to $67.30 (50% expansion) region, while the RSI appears to on track to threaten the bearish formation carried over from the previous month.
- Need a break/close above $70.40 (78.6% expansion) bringing the topside targets back on the radar, with the first region of interest coming in around $71.00 (50% expansion) to $71.20 (38.2% expansion) followed by the Fibonacci overlap around $72.70 (50% expansion) to $72.80 (100% expansion).
- Break/close above the former-support zone brings up the $74.00 (61.8% expansion) handle followed by the $75.20 (78.6% expansion) to $75.90 (78.6% expansion) region, which largely lines up with the July-high ($75.24).
For more in-depth analysis, check out the Q3 Forecast for Oil
Interested in having a broader discussion on current market themes? Sign up and join DailyFX Currency Analyst David Song LIVE for an opportunity to discuss potential trade setups!
Additional Trading Resources
Are you looking to improve your trading approach? Review the ‘Traits of a Successful Trader’ series on how to effectively use leverage along with other best practices that any trader can follow.
Want to know what other currency pairs the DailyFX team is watching? Download and review the Top Trading Opportunities for 2018.
--- Written by David Song, Currency Analyst
Follow me on Twitter at @DavidJSong.


