


Gold Talking Points
Gold prices remain under pressure despite the growing threat of a trade war, and recent price action raises the risk for a further decline in bullion as the bearish momentum appears to be gathering pace.
Gold Vulnerable to Further Losses as Bearish Momentum Gathers Pace
Gold has finally cleared the December-low ($1236), with the precious metal slipping to a fresh 2018-low of $1221, and the downside targets remain on the radar as retail sentiment sits at an extreme.
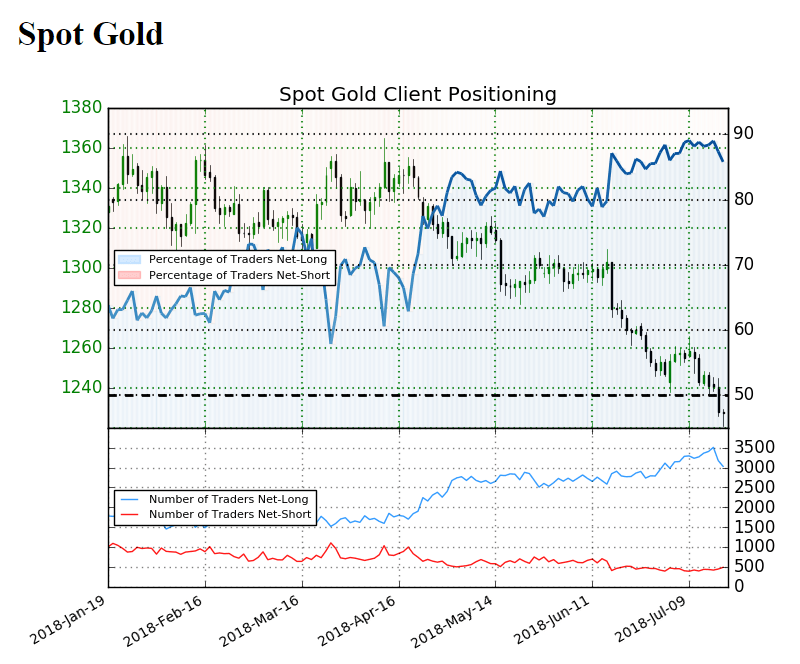
The IG Client Sentiment Report shows 85.8% of traders are now net-long, down from 88.0% during the previous week, with the ratio of traders long to short at 6.03 to 1. The number of traders net-long gold is 13.5% lower than yesterday and 9.1% lower from last week, while the number of traders net-short is 9.1% higher than yesterday and 15.1% higher from last week.
The fact that retail traders remain heavily net-long gold offers a contrarian view as gold continues to track the downward trend from earlier this year, and the skew in retail positioning keeps the precious metal at risk for further losses as the bearish momentum appears to be gathering pace.
Recent price action warns of lower gold prices as the precious metal starts to carve a fresh series of lower highs & lows, and billion may exhibit a more bearish behavior over the coming days as the Relative Strength Index (RSI) dips back into oversold territory.
Gold Daily Chart
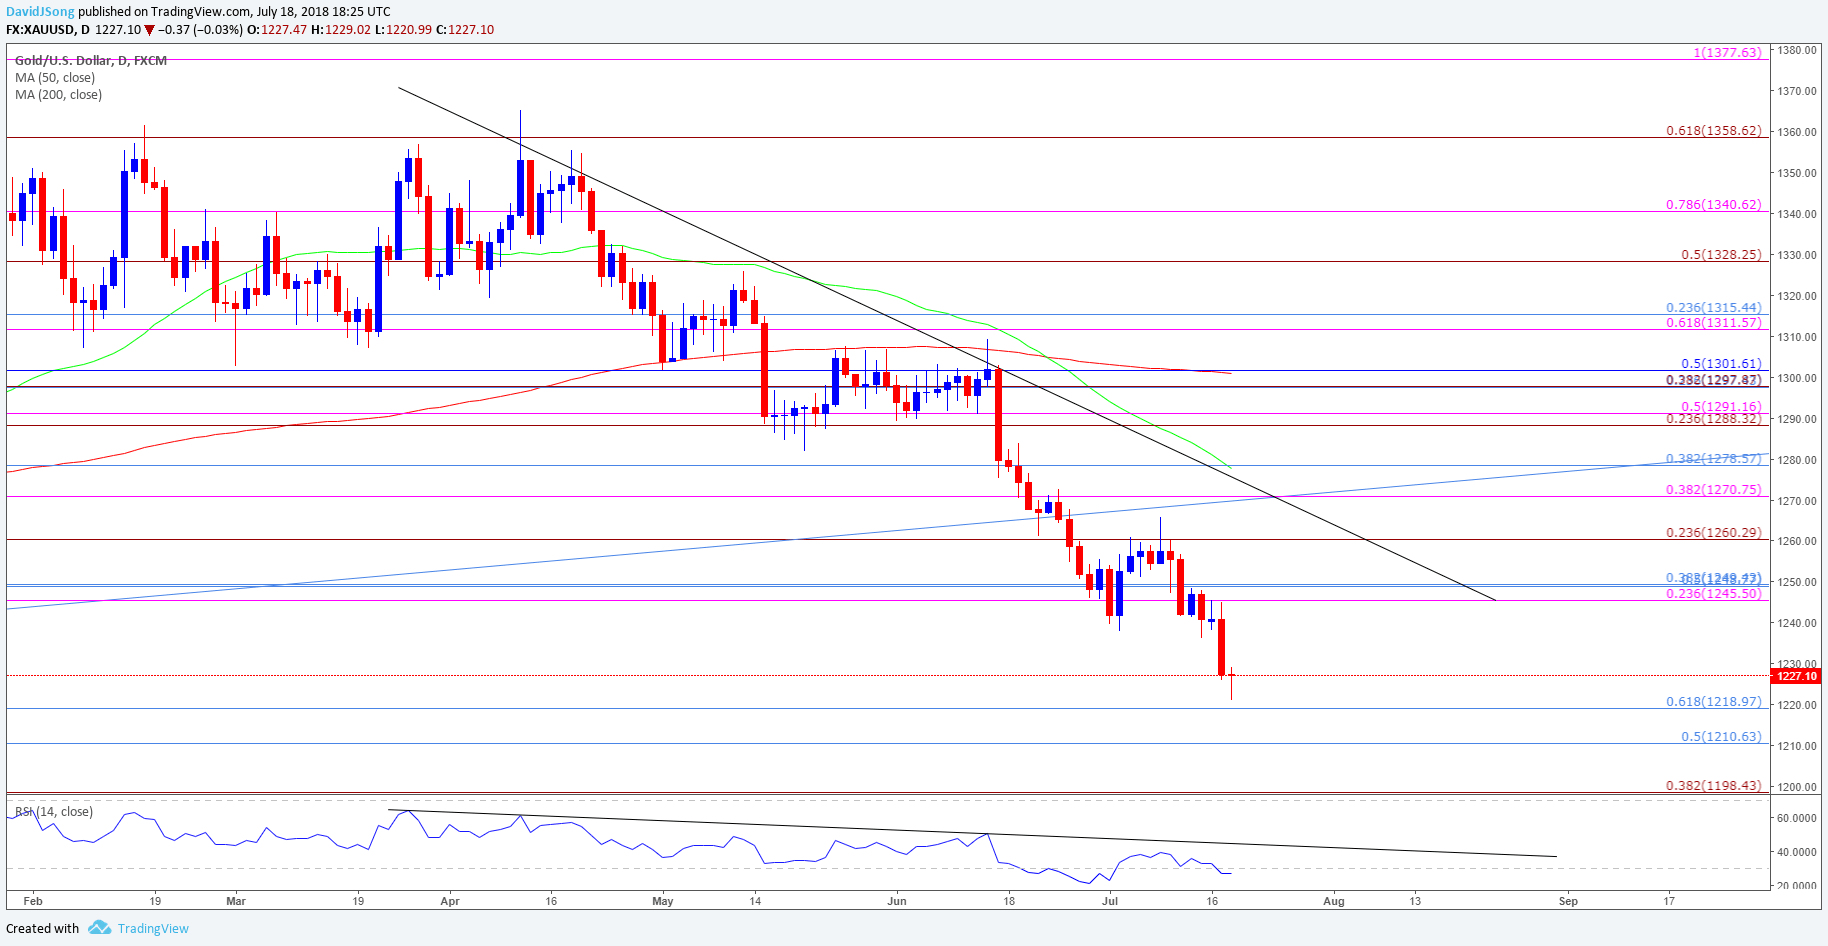
- Broader outlook for gold remains tilted to the downside as both price and the Relative Strength Index (RSI) extend the bearish trends from earlier this year, and the precious metal appears to be on its way to test the July 2017-low ($1205) as it carves a fresh series string of lower highs & lows.
- The $1210 (50% retracement) to $1219 (61.8% retracement) sits on the radar as gold remains under pressure, with the next region of interest coming in around $1198 (38.2% expansion).
For more in-depth analysis, check out the Q3 Forecast for Gold
Interested in having a broader discussion on current market themes? Sign up and join DailyFX Currency Analyst David Song LIVE for an opportunity to discuss potential trade setups!
Additional Trading Resources
Are you looking to improve your trading approach? Review the ‘Traits of a Successful Trader’ series on how to effectively use leverage along with other best practices that any trader can follow.
Want to know what other currency pairs the DailyFX team is watching? Download and review the Top Trading Opportunities for 2018.
--- Written by David Song, Currency Analyst
Follow me on Twitter at @DavidJSong.


