


Gold Talking Points
Gold prices appear to be on the cusp of a larger rebound following the failed attempt to test the December-low ($1236), and recent price action brings the topside targets back on the radar as the Relative Strength Index (RSI) finally bounces back from oversold territory.
Gold Prices Risk Larger Rebound Followed Failed Run at December-Low
The monthly opening range remains in focus for gold as it snaps back from a fresh 2018-low ($1238), and the precious metal may stage a more meaningful recovery over the coming days as there appears to be a near-term change in market positioning.
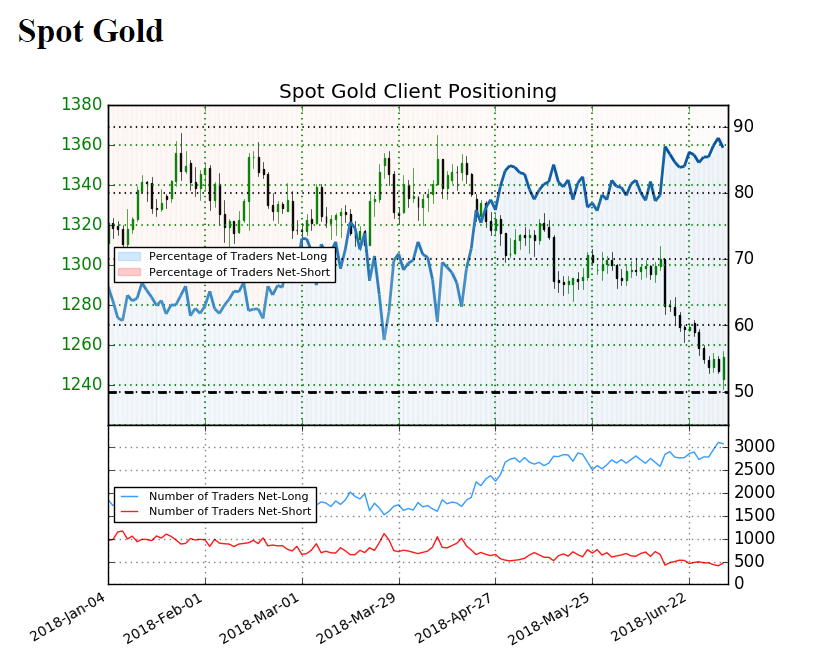
A look at the IG Client Sentiment Report shows retail interest remains heavily skewed as recent updates show 88.5% of traders are net-long with the ratio of traders long to short at 7.67 to 1, while the number of traders net-long are 6.0% higher than yesterday and 8.2% higher from last week. At the same time, the number of traders net-short is 1.1% lower than yesterday and 11.1% lower from last week, which suggests the recent volatility in gold prices could be a mere function of profit-taking behavior.
Keep in mind, the fact traders are heavily net-long suggests the broader outlook for gold remains tilted to the downside especially as price and the Relative Strength Index (RSI) continue to track the bearish trends from earlier this year, but recent price action warns of a larger rebound as the momentum indicator climbs back above 30 and flashes a textbook buy signal.
Gold Daily Chart
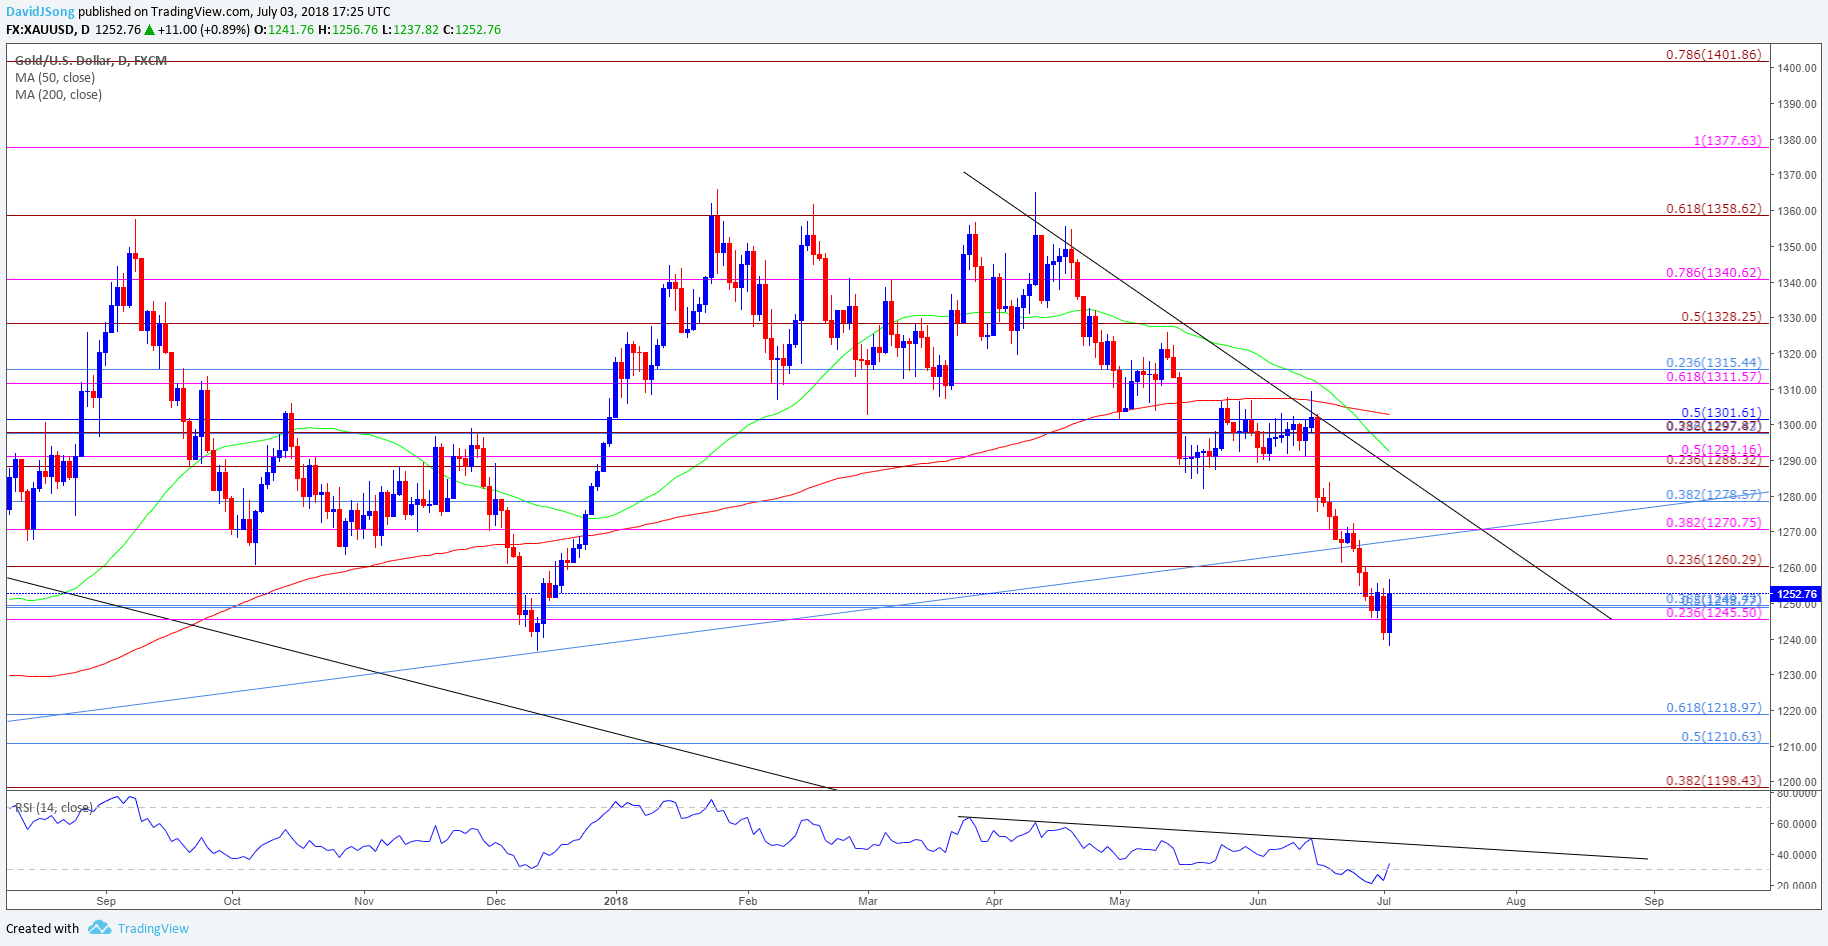
- Gold prices have faced marked selloff even after the death-cross formation took shake, but the failed run at the December-low ($1236) raises the risk for a larger rebound, with a break/close above the $1260 (23.6% expansion) hurdle bringing the topside targets back on the radar.
- Next area of interest comes in around $1271 (38.2% expansion) to $1279 (38.2% retracement) followed by the Fibonacci overlap around $1288 (23.6% expansion) to $1291 (50% expansion).
For more in-depth analysis, check out the Q3 Forecast for Gold
Interested in having a broader discussion on current market themes? Sign up and join DailyFX Currency Analyst David Song LIVE for an opportunity to discuss potential trade setups!
Additional Trading Resources
Are you looking to improve your trading approach? Review the ‘Traits of a Successful Trader’ series on how to effectively use leverage along with other best practices that any trader can follow.
Want to know what other currency pairs the DailyFX team is watching? Download and review the Top Trading Opportunities for 2018.
--- Written by David Song, Currency Analyst
Follow me on Twitter at @DavidJSong.


