


Gold Talking Points
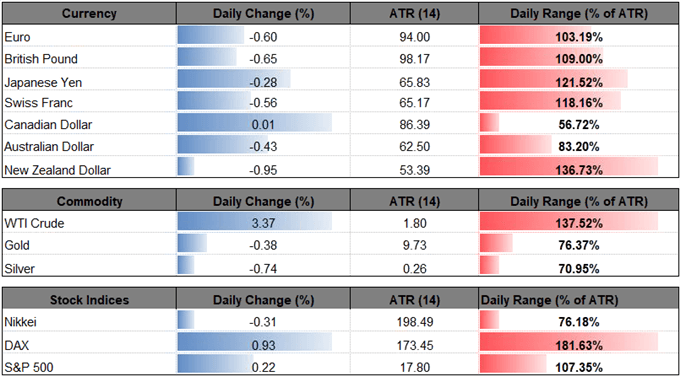
Gold prices appear to be on track to test the December-low ($1236) despite the growing threat for a global trade war, and current conditions may keep bullion under pressure as the reach for yield dampens the appeal of the precious metal.
Gold Prices Eye December Low as Death Cross Takes Shape
Market participants appear to be dumping gold as the U.S. dollar appreciates against its major counterparts, and the precious metal is likely to face headwinds throughout the second-half of the year as the Federal Open Market Committee (FOMC) shows a greater willingness to implement four rate-hikes in 2018.
The Fed’s hiking-cycle may continue to weigh on gold prices as the central bank is widely anticipated to deliver another 25bp rate-hike in September, and it seems as though Chairman Jerome Powell and Co. will take further steps to normalize monetary policy in 2019 as ‘gradually returning interest rates to a more normal level as the economy strengthens is the best way the Fed can help sustain an environment in which American households and businesses can thrive.’
With that said, recent price action highlights the risk for further decline as a death-cross unfolds, with the 50-Day & 200-Day SMA highlighting a similar slope as they cross over, and the bearish momentum certainly appears to be gathering pace as the Relative Strength Index (RSI) pushes deeper into oversold territory.
Gold Daily Chart

- Downside targets remain on the radar for gold as long as the RSI holds below 30, with the next region of interest coming in around $1246 (23.6% expansion) to $1249 (38.2% retracement) followed by the December-low ($1236).
- Keep in mind, the RSI continues to track the bearish formation from earlier this year and is trading below 30 for the first time since 2016, with the weakness in gold prices to persist as the bearish momentum appears to be gathering pace.
For more in-depth analysis, check out the Q2 Forecast for Gold
Interested in having a broader discussion on current market themes? Sign up and join DailyFX Currency Analyst David Song LIVE for an opportunity to discuss potential trade setups!
Additional Trading Resources
Are you looking to improve your trading approach? Review the ‘Traits of a Successful Trader’ series on how to effectively use leverage along with other best practices that any trader can follow.
Want to know what other currency pairs the DailyFX team is watching? Download and review the Top Trading Opportunities for 2018.
--- Written by David Song, Currency Analyst
Follow me on Twitter at @DavidJSong.


