


FX TALKING POINTS:
- USD/JPY Rebound Fizzles Following Dismal U.S. Consumer Confidence Survey. Final Revisions to 4Q U.S. Gross Domestic Product (GDP) Report in Focus.
- Gold Price Outlook Mired by Bearish Outside-Day (Engulfing) Candle. Relative Strength Index (RSI) Flops Ahead of Overbought Territory.
USD/JPY REBOUND FIZZLES FOLLOWING DISMAL U.S. CONSUMER CONFIDENCE SURVEY.
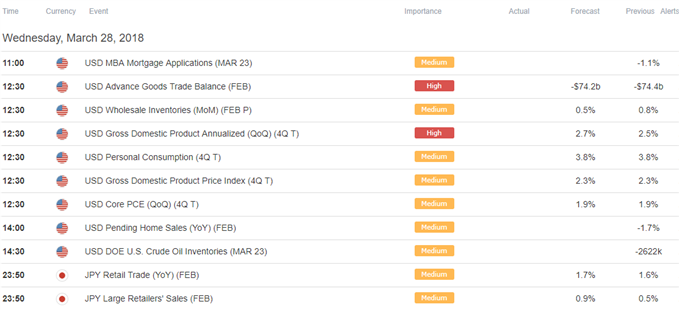
USD/JPY struggles to preserve the advance from earlier this week as the U.S. Consumer Confidence survey unexpectedly narrows in March, but updates to the 4Q U.S. Gross Domestic Product (GDP) report may ultimately fuel the near-term rebound in dollar-yen should the fresh figures encourage the Federal Open Market Committee (FOMC) to deliver four rate-hikes in 2018.
The final revision to the GDP report is expected to show an uptick in the growth rate, with the economy projected to grow an annualized 2.7% versus an initial forecast of 2.5%. A batch of positive developments may heighten the appeal of the greenback as it raises the Fed’s scope to extend its hiking-cycle, and the FOMC may prepare U.S. households and businesses for an imminent rate-hike as ‘the Committee expects that economic conditions will evolve in a manner that will warrant further gradual increases in the federal funds rate.’
However, another set of below-forecast prints may continue to undermine the near-term rebound in USD/JPY, with the pair at risk of facing choppy prices as market participation is likely to thin ahead of the Easter holiday.
USD/JPY DAILY CHART

- Near-term outlook for USD/JPY is becoming clouded with mixed signals as the pair pulls back from the weekly-high (105.90) and struggles to extend the recent series of higher highs & lows.
- Keeping a close eye on the Relative Strength Index (RSI) as it continues to hold above oversold territory, with the oscillator at risk of threatening the bearish formations carried over from the previous year as it start to diverge with price.
- Failure to hold above the 105.40 (50% retracement) may produce range-bound conditions for USD/JPY, with the 104.10 (78.6% retracement) to 104.20 (61.8% retracement) back on the radar as the near-term rebound in the exchange rate fizzles.
GOLD PRICE OUTLOOK MIRED BY BEARISH OUTSIDE-DAY (ENGULFING) CANDLE.
Gold prices are back under pressure following the failed attempt to test the February-high ($1362), and the precious metal may face a larger pullback going into the end of the month as a bearish outside-day (engulfing) takes shape.
Bear in mind that gold broke out of a near-term range even as the Federal Open Market Committee (FOMC) delivered a 25bp rate-hike on March 21, and the broader outlook remains constructive as both price and the Relative Strength Index (RSI) snap the bearish formations carried over from earlier this year. It seems as though the Fed’s preset course for monetary policy will continue to shore up gold prices as Chairman Jerome Powell and Co. persistently forecast a neutral Fed Funds rate of 2.75% to 3.00%, but recent price action warns of range-bound conditions as the advance from the monthly-low ($1303) starts to unravel.
With that said, the precious metal may consolidate going into April, with gold at risk of facing further losses over the coming days as it breaks the series of higher highs & lows from the previous week.
XAU/USD DAILY CHART

- The recent series of failed attempts to test the $1359 (61.8% expansion) hurdle raises the risk for a larger pullback, with a break/close below $1341 (78.6% expansion) bringing the downside targets back on the radar especially as the RSI flops ahead of overbought territory.
- Next downside region of interest comes in around $1328 (50% expansion) followed by the Fibonacci overlap around $1312 (61.8% expansion) to $1315 (23.6% retracement), with key support coming in around $1297 (23.6% retracement) to $1302 (50% retracement), which sits just beneath the monthly-low ($1303).
Interested in having a broader discussion on current market themes? Sign up and join DailyFX Currency Analyst David Song LIVE for an opportunity to discuss potential trade setups!
Additional Trading Resources
Are you looking to improve your trading approach? Review the ‘Traits of a Successful Trader’ series on how to effectively use leverage along with other best practices that any trader can follow.
Want to know what other currency pairs the DailyFX team is watching? Download and review the Top Trading Opportunities for 2018.
--- Written by David Song, Currency Analyst
To contact David, e-mail dsong@dailyfx.com. Follow me on Twitter at @DavidJSong.
To be added to David's e-mail distribution list, please follow this link.


