

FX Talking Points:
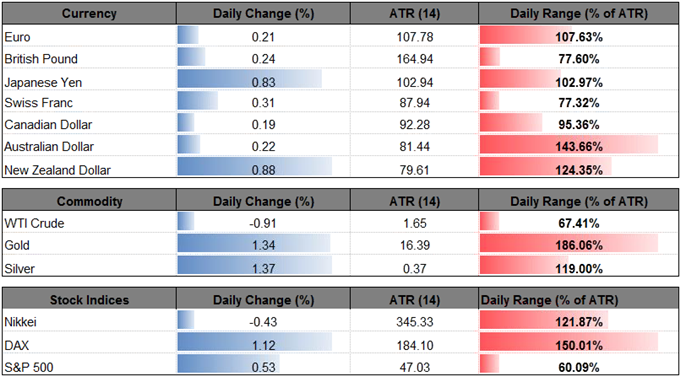
- USD/JPY Rate Extends Bearish Sequence, RSI Slips Back Into Oversold Territory.
- GBP/USD Risks Larger Advance on Upbeat U.K. Retail Sales Report.
USD/JPY remains under pressure following a series of lackluster U.S. data prints, and the pair remains at risk for further losses as it extends the bearish sequence from earlier this week.
Updates to the U.S. Consumer Price Index (CPI) have sparked a mixed reaction in dollar-yen even as the headline and core rate of inflation unexpectedly held steady in January, and the recent slowdown in Retail Sales appears to be dampening the appeal of the greenback as the fresh data prints stoke fears of stagflation.
Bear in mind, signs of sticky price growth may keep the Federal Open Market Committee (FOMC) on course to deliver a March rate-hike, but central bank officials may start to project a more shallow path for the benchmark interest rate in an effort to combat the weakness in private-sector consumption, one of the leading drivers of growth.
With that said, downside targets remain on the radar for the remainder of the week, with the pair at risk for further losses ahead of the FOMC interest rate decision on March 21 as the bearish momentum appears to be gathering pace.
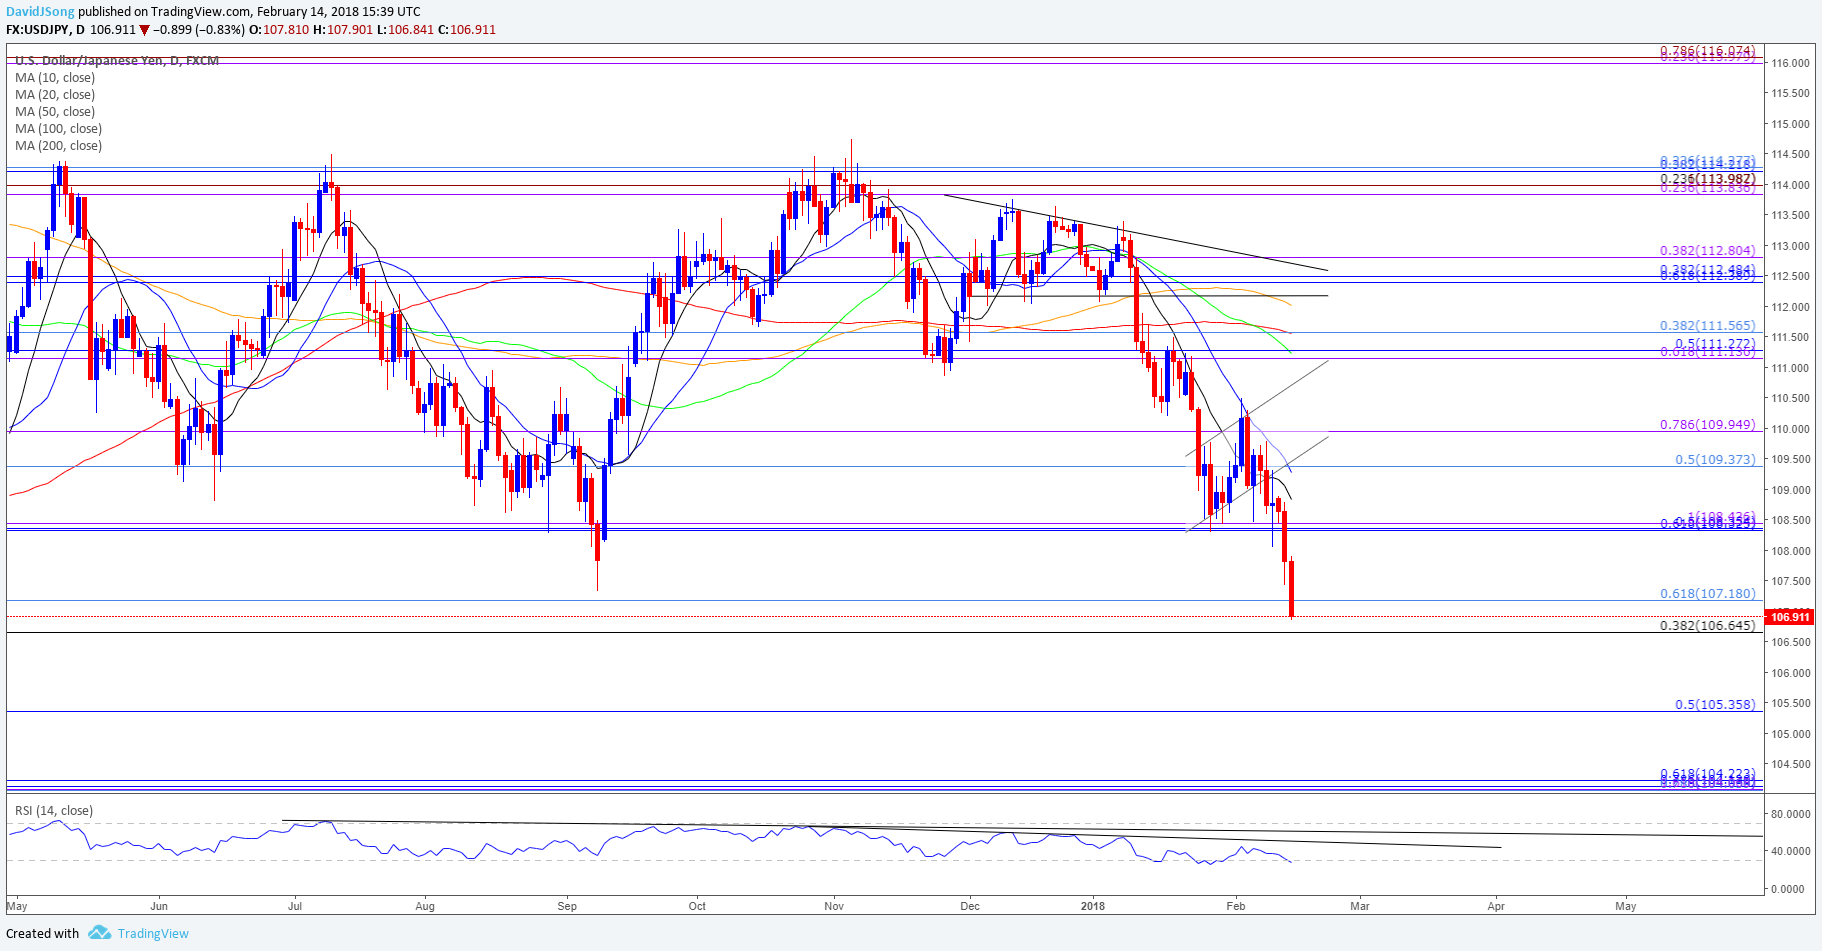
USD/JPY Daily Chart
Interested in trading? Review the ‘Traits of a Successful Trader’ series on how to effectively use leverage along with other best practices that any trader can follow.
- Downside targets remain on the radar as a bear-flag unfolds, with USD/JPY at risk of extending the series of lower highs & lows from earlier this week as the Relative Strength Index (RSI) appears to be slipping back into oversold territory.
- Need a break/close below the 106.70 (38.2% retracement) to 107.20 (61.8% retracement) region to open up the 105.40 (50% retracement) hurdle, with the next area of interest coming in around 104.10 (78.6% retracement) to 104.20 (61.8% retracement).
GBP/USD pares the decline from the previous week following the bullish reaction to the U.K. Consumer Price Index (CPI), and another batch of positive data prints may generate a more meaningful advance in the pound-dollar exchange rate as it puts pressure on the Bank of England (BoE) to raise the benchmark interest rate sooner rather than later.
A 0.6% rebound in U.K. Retail Sales may encourage the BoE to implement a 25bp rate-hike at the next meeting on March 22 as ‘the Committee judges that, were the economy to evolve broadly in line with the February Inflation Report projections, monetary policy would need to be tightened somewhat earlier and by a somewhat greater extent over the forecast period than anticipated at the time of the November Report, in order to return inflation sustainably to the target.’
As a result, Governor Mark Carney and Co. may continue to prepare U.K. households and businesses for higher borrowing-costs, with GBP/USD at risk of extending the rebound from the monthly-low (1.3765) as it snaps the series of lower-highs from the previous week. Keep in mind, the broader forecast for GBP/USD remains constructive as the pair preserves the upward trend from late-2017, but the near-term outlook for GBP/USD remains clouded with mixed signals as the Relative Strength Index (RSI) continues to track the bearish formation carried over from the previous month.
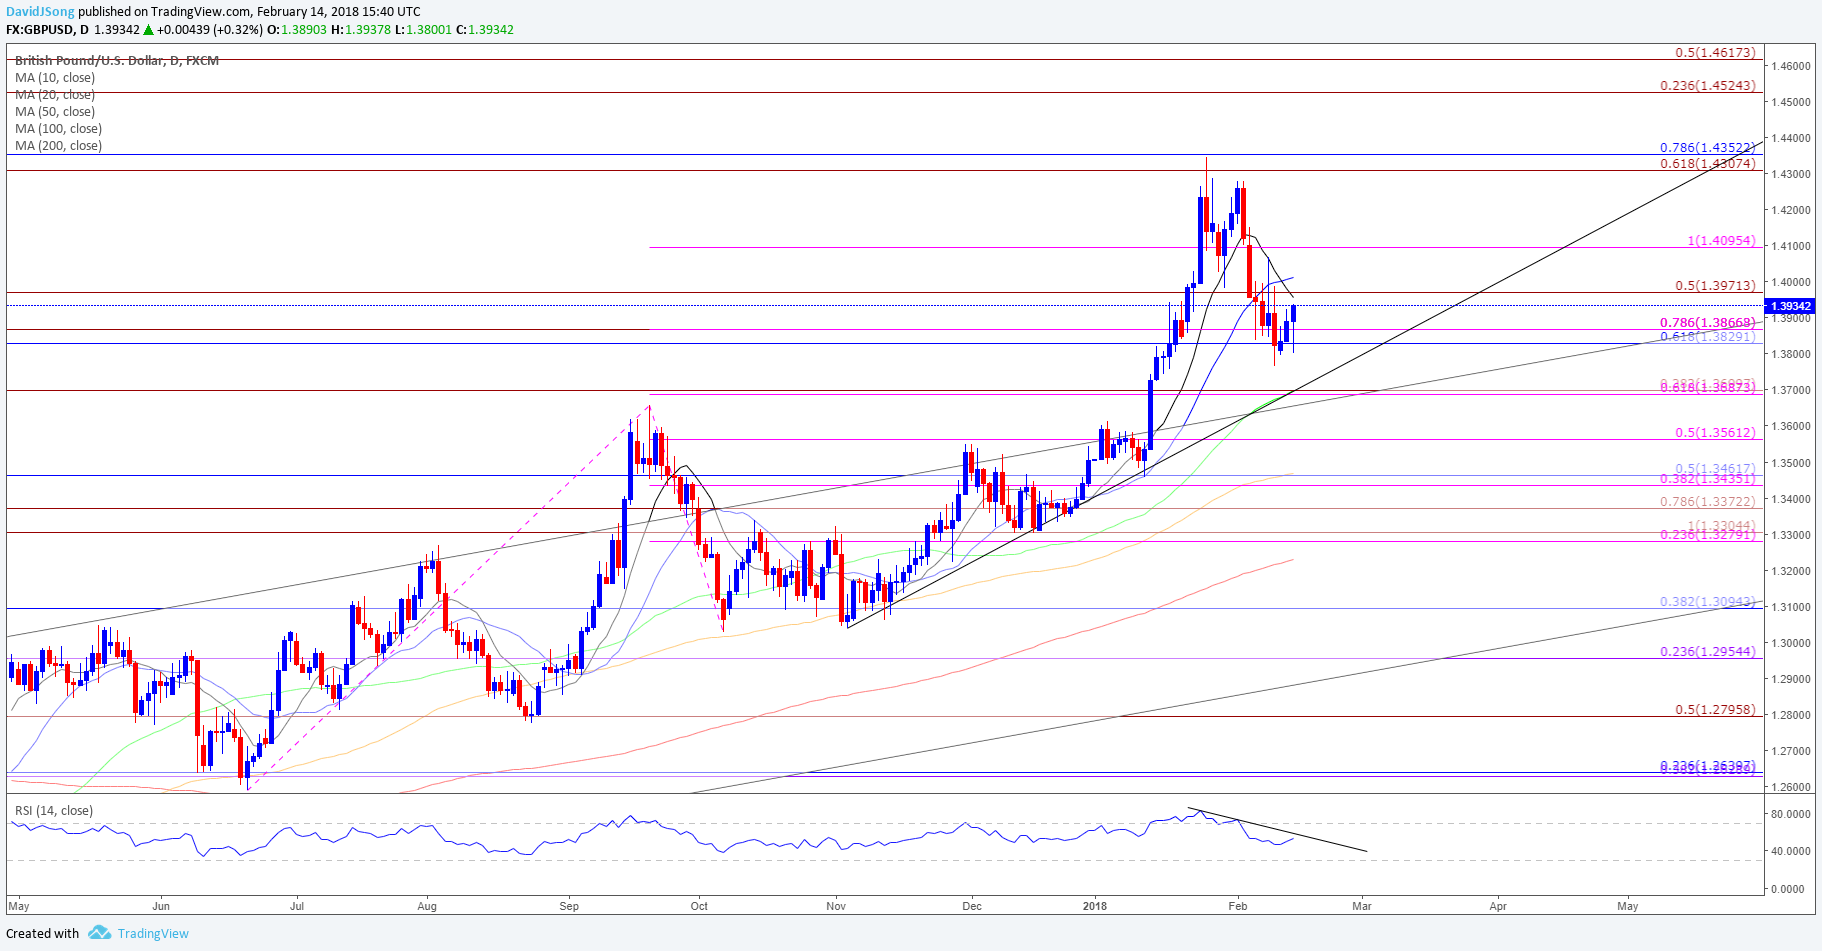
GBP/USD Daily Chart
Want to know what other currency pairs the DailyFX team is watching? Download and review the Top Trading Opportunities for 2018.
- Series of failed attempts to test the former-resistance zone around 1.3690 (61.8% expansion) to 1.3700 (38.2% expansion) may bring the topside targets back on the radar for GBP/USD as the consolidates above trendline support.
- Need to see a close above the 1.3970 (50% expansion) region paired with a bullish RSI signal to instill a bullish outlook, with the next topside hurdle coming in the 1.4.100 (100% expansion) handle followed by the Fibonacci overlap around 1.4310 (61.8% expansion) to 1.4350 (78.6% retracement), which lines up with the 2018-high (1.4346).
Interested in having a broader discussion on current market themes? Sign up and join DailyFX Currency Analyst David Song LIVE for an opportunity to discuss potential trade setups!
--- Written by David Song, Currency Analyst
To contact David, e-mail dsong@dailyfx.com. Follow me on Twitter at @DavidJSong.
To be added to David's e-mail distribution list, please follow this link.