


Talking Points:
- EUR/USD Eyes September High Again as ECB Pledges to Alter Forward Guidance.
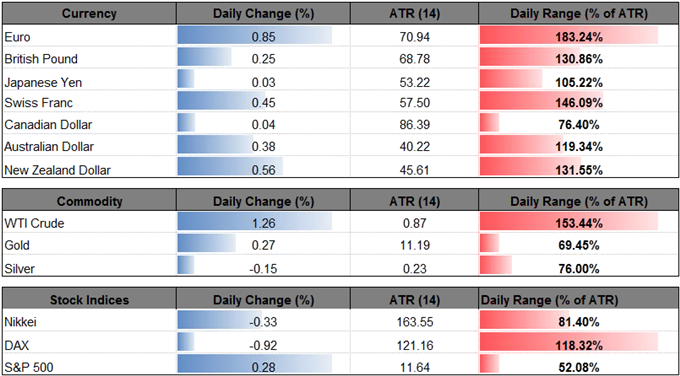
- USD/JPY Rebound Fizzles as U.S. Producer Price Index (PPI) Warns of Subdued Inflation.
EUR/USD appears to be making another run at the September-high (1.2092) as the European Central Bank (ECB) strikes an upbeat tone and warns ‘the Governing Council’s communication would need to evolve gradually.’
The account of the December monetary policy meeting suggests the ECB will stay on its current course to wind down the quantitative easing (QE) program by September 2018 as ‘the latest staff projections foresaw that the output gap would close in the near future, earlier than previously projected.’
Even though ‘members widely agreed that the Governing Council needed to remain patient and persistent with its monetary policy,’ President Mario Draghi and Co. may continue to prepare European households and businesses for a less accommodative stance as officials note ‘that the Governing Council’s communication should be adjusted gradually over time to avoid sudden and unwarranted movements in financial conditions.’
As a result, the ongoing shift in the monetary policy outlook should continue to prop up the single-currency, with EUR/USD at risk of extending the advance from the November-low (1.1554) as both price and the Relative Strength Index (RSI) extend the bullish formations carried over from late last year. For additional resources, download and review the DailyFX Top Trading Opportunities for 2018.
EUR/USD Daily Chart

Interested in trading? Review the ‘Traits of a Successful Trader’ series on how to effectively use leverage along with other best practices that any trader can follow.
- May see EUR/USD continue to ward off the risk for a double-top as the pair snaps the bearish sequence from earlier this month, with the broader outlook still constructive as a bull-flag formation appears to be panning out at the start of 2018.
- Still need to see a break above the September-high (1.2092) to open up the 1.2130 (50% retracement) hurdle, with the next region of interests coming in around 1.2230 (50% retracement).
- Keeping a close eye on the Relative Strength Index (RSI) as it appears to kissing off of trendline support, with the euro-dollar exchange rate at risk for a more meaningful advance should the oscillator push into overbought territory.
USD/JPY is back under pressure as the U.S. Produce Price Index (PPI) falls short of market expectations, with the headline reading for factory-gate prices narrowing to an annualized 2.6% from 3.1% in November.
The fresh updates to the Consumer Price Index (CPI) may spark a similar reaction as the figure is expected to slow to 2.1% per annum from 2.2% in November, and another batch of lackluster data prints may undermine the Federal Reserve’s ability to implement three rate-hikes in 2018 as inflation continues to run below the central bank’s 2% target.
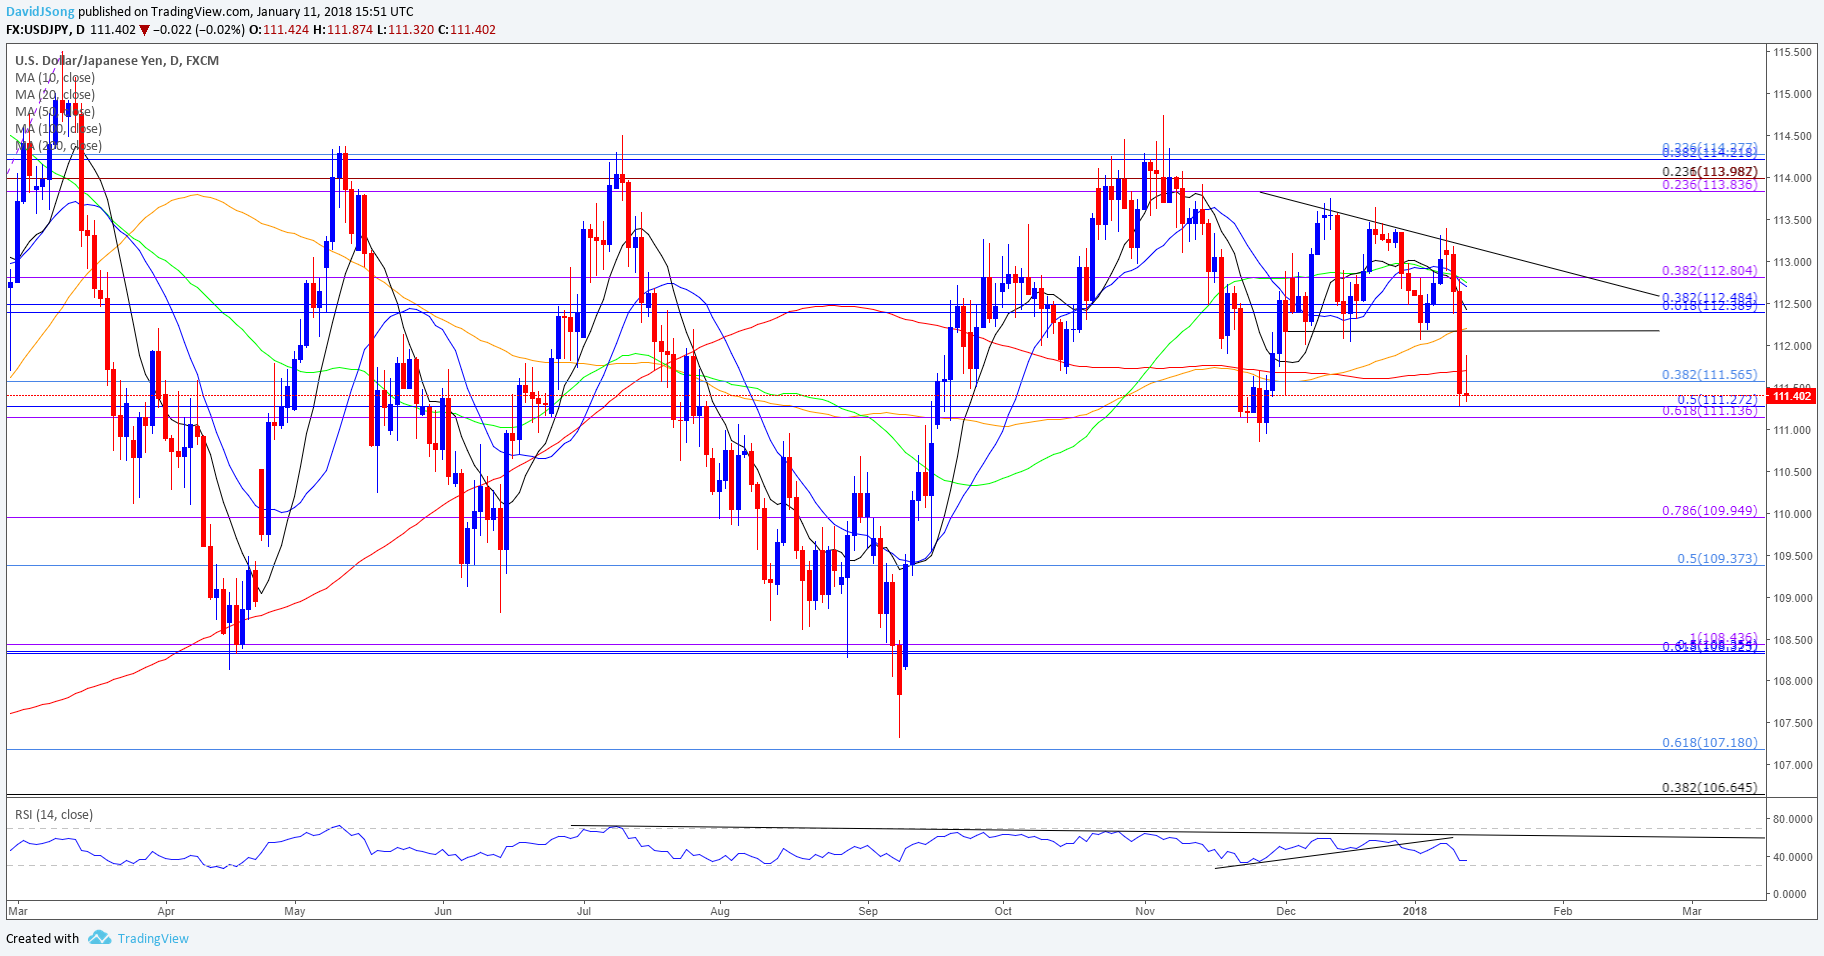
In turn, recent price action keeps the near-term outlook tilted to the downside, with USD/JPY at risk of giving back the rebound from the November-low (110.84) as it extends the series of lower-highs from earlier this week. Keep in mind, the break of the descending triangle may lead to a more meaningful decline in the dollar-yen exchange rate especially as the Relative Strength Index (RSI) continues to track the bearish formation carried over from the summer months.
USD/JPY Daily Chart
Interested in having a broader discussion on current market themes? Sign up and join DailyFX Currency Analyst David Song LIVE for an opportunity to discuss potential trade setups!
- Still waiting for a break/close below the 111.10 (61.8% expansion) to 111.60 (38.2% retracement) region to open up the downside targets, with the next region of interest coming in around 109.40 (50% retracement) to 110.00 (78.6% expansion).
- Keeping a close eye in the RSI as it approaches oversold territory, with a break below 30 raising the risk for a further decline in the exchange rate as the bearish momentum gathers pace.

Click Here for the DailyFX Calendar
--- Written by David Song, Currency Analyst
To contact David, e-mail dsong@dailyfx.com. Follow me on Twitter at @DavidJSong.
To be added to David's e-mail distribution list, please follow this link.


