


Talking Points:
- USD/JPY Weakness to Persist on Dovish FOMC Minutes.
- USD/CAD Inverse Head & Shoulders Remains in Play Amid Slowing Canada CPI.
The Japanese Yen outperforms its major counterparts going into the last full-week of November, and USD/JPY may continue to give back the rebound from the 2017-low (107.32) should the Federal Open Market Committee (FOMC) Minutes drag on interest-rate expectations.
In light of the muted reaction to the 13.7% rise in U.S. Housing Starts, it seems as though market participants are still deciphering the fresh rhetoric from central bank officials especially as Dallas Fed President Robert Kaplan, a 2017-voting member, warns the 10-Year U.S. Treasury yield reflects pessimism for future growth. Even though the FOMC is widely anticipated to further normalize monetary policy in December, Mr. Kaplan noted that ‘prudent risk management means some action to remove accommodation gradually and patiently,’ and the FOMC may ultimately deliver a dovish rate-hike as the central bank struggles to achieve the 2% target for inflation.
With that said, a slew of cautious remarks from Fed officials may dampen the appeal of the greenback, with USD/JPY at risk of exhibiting a more bearish behavior ahead of the major U.S. holiday as the near-term outlook remains capped by the 113.80 (23.6% expansion) to 114.30 (23.6% retracement) region.
USD/JPY Daily Chart
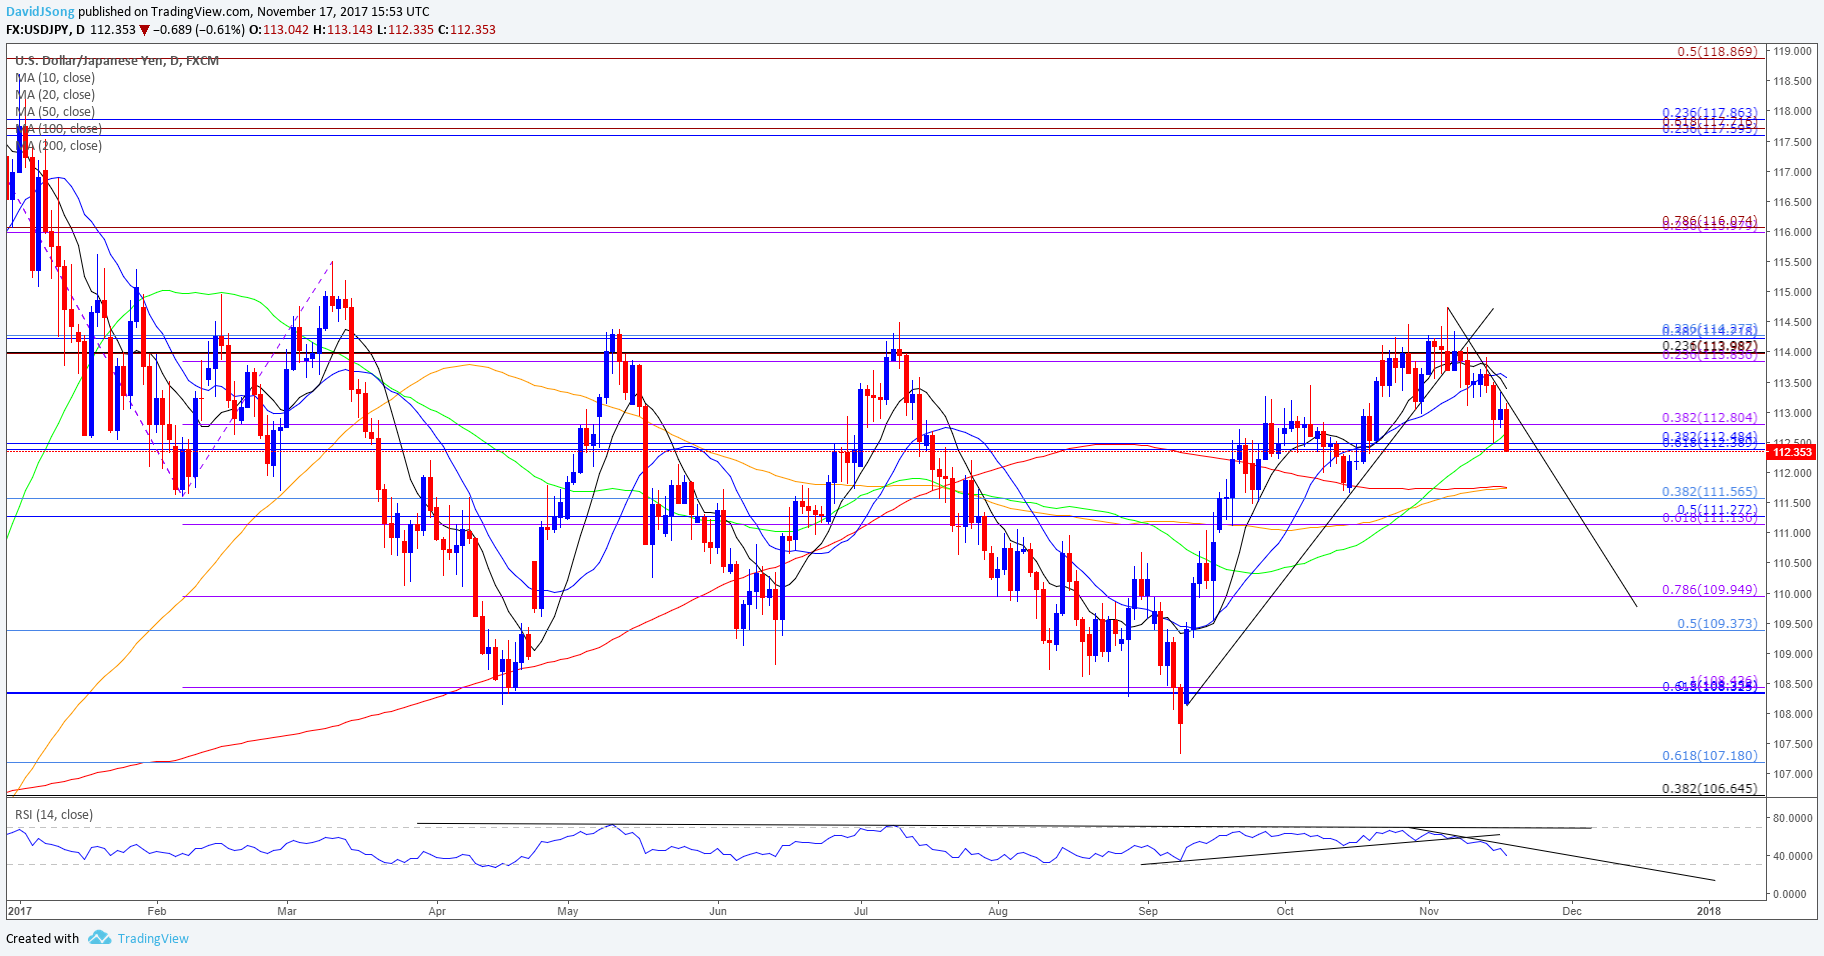
- Downside targets remain on the radar for USD/JPY as both price and the Relative Strength Index (RSI) start to carve a bearish trend, with a close below the 112.30 (61.8% retracement) to 112.80 (38.2% expansion) region raising the risk for a move back towards 111.10 (61.8% expansion) to 111.30 (50% retracement).
- With the broader range back in play, next downside target comes in around 109.40 (50% retracement) to 110.00 (78.6% expansion) followed by the Fibonacci overlap around 108.30 (61.8% retracement) to 108.40 (100% expansion).
USD/CAD extends the advance from earlier this week as Canada’s Consumer Price Index (CPI) narrows for the first time since June, and the pair may stage a larger correction over the remainder of the month as both price and the Relative Strength Index (RSI) preserve the bullish trends from September.
With the headline reading for inflation slowing to an annualized 1.4% from 1.6% in September, signs of below-target inflation is likely to keep the Bank of Canada (BoC) on the sidelines at the next meeting on December 6 as ‘growth is expected to moderate to a more sustainable pace in the second half of 2017 and remain close to potential over the next two years.’ In turn, the inverse head-and-shoulders formation in USD/CAD may continue to unfold over the coming days, and the pair stay bid over the near-term should Governor Stephen Poloz and Co. tame expectations for an imminent rate-hike.
Keep in mind, the BoC may gradually change its tune next year as ‘the Bank projects inflation will rise to 2 per cent in the second half of 2018,’ and the broader shift in USD/CAD behavior keeps the longer-term outlook tilted to the downside as the BoC ‘estimates that the economy is operating close to its potential.’
USD/CAD Daily Chart

- Topside targets are back on the radar for USD/CAD following the failed attempt to test the 1.2620 (50% retracement) hurdle, with the pair at risk for a larger correction as it appears to be turning around ahead of channel support.
- In turn, a break/close above the 1.2830 (38.2% retracement) region raising the risk for a run at the October-high (1.2917), with the next topside hurdle comes in around 1.2980 (61.8% retracement) to 1.3030 (50% expansion), which largely lines up with the 200-Day SMA (1.2983).
Varying market conditions require alternative strategies as trends change. Want a better understanding of the different approaches for trading? Download and review the FREE DailyFX Advance trading guide !
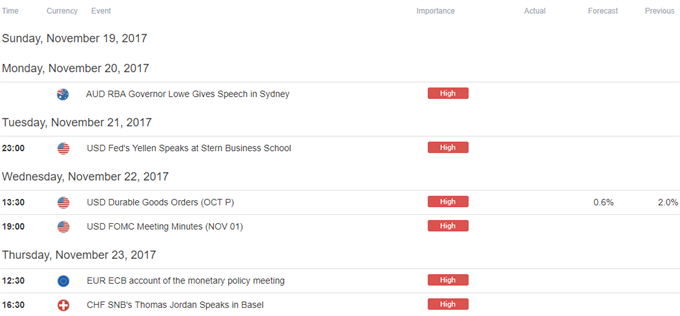
Click Here for the DailyFX Calendar
Interested in having a broader discussion on current market themes? Sign up and join DailyFX Currency Analyst David Song LIVE for an opportunity to discuss potential trade setups!
--- Written by David Song, Currency Analyst
To contact David, e-mail dsong@dailyfx.com. Follow me on Twitter at @DavidJSong.
To be added to David's e-mail distribution list, please follow this link.


