


Talking Points:
- Crude Oil Prices Flash Overbought Signal for First Time in 2017.
- Cautious RBA Statement on Monetary Policy to Fuel AUD/USD Weakness.
Crude rallied to $57.67 after unexpectedly breaking the January-high ($55.21) at the end of the previous week, and oil prices may stay bid ahead of the Organization of the Petroleum Exporting Countries’ (OPEC) next meeting on November 30 as Relative Strength Index (RSI) pushes into overbought territory for the first time in 2017.
With OPEC and its allies largely committed to rebalancing the energy market, it seems as though the group will extend the output cuts beyond March 2018, but the pickup in crude oil prices appears to be having an adverse effect as the Monthly Oil Market Report (MOMR) for October warns higher prices ‘would encourage US oil producers to expand their drilling activities.’
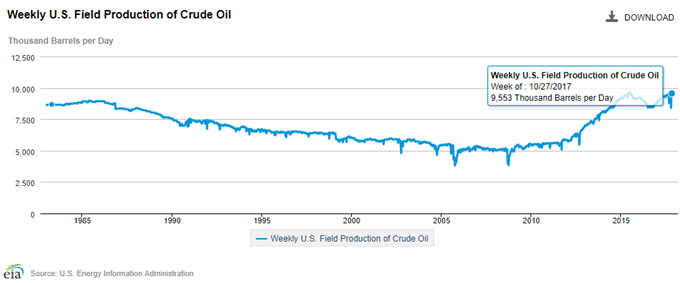
Keeping in mind, U.S. field production sits near the 2017-high (9,561) even as crude inventories are projected to narrow another 2708K in the week ending November 3. In turn, market participants may pay increased attention to the ongoing expansion in U.S. output as ‘the main factors for higher growth expectations for the remaining month of 2017 compared to last year are the current improving price environment, which is more suitable for shale producers.’
USOIL Daily Chart
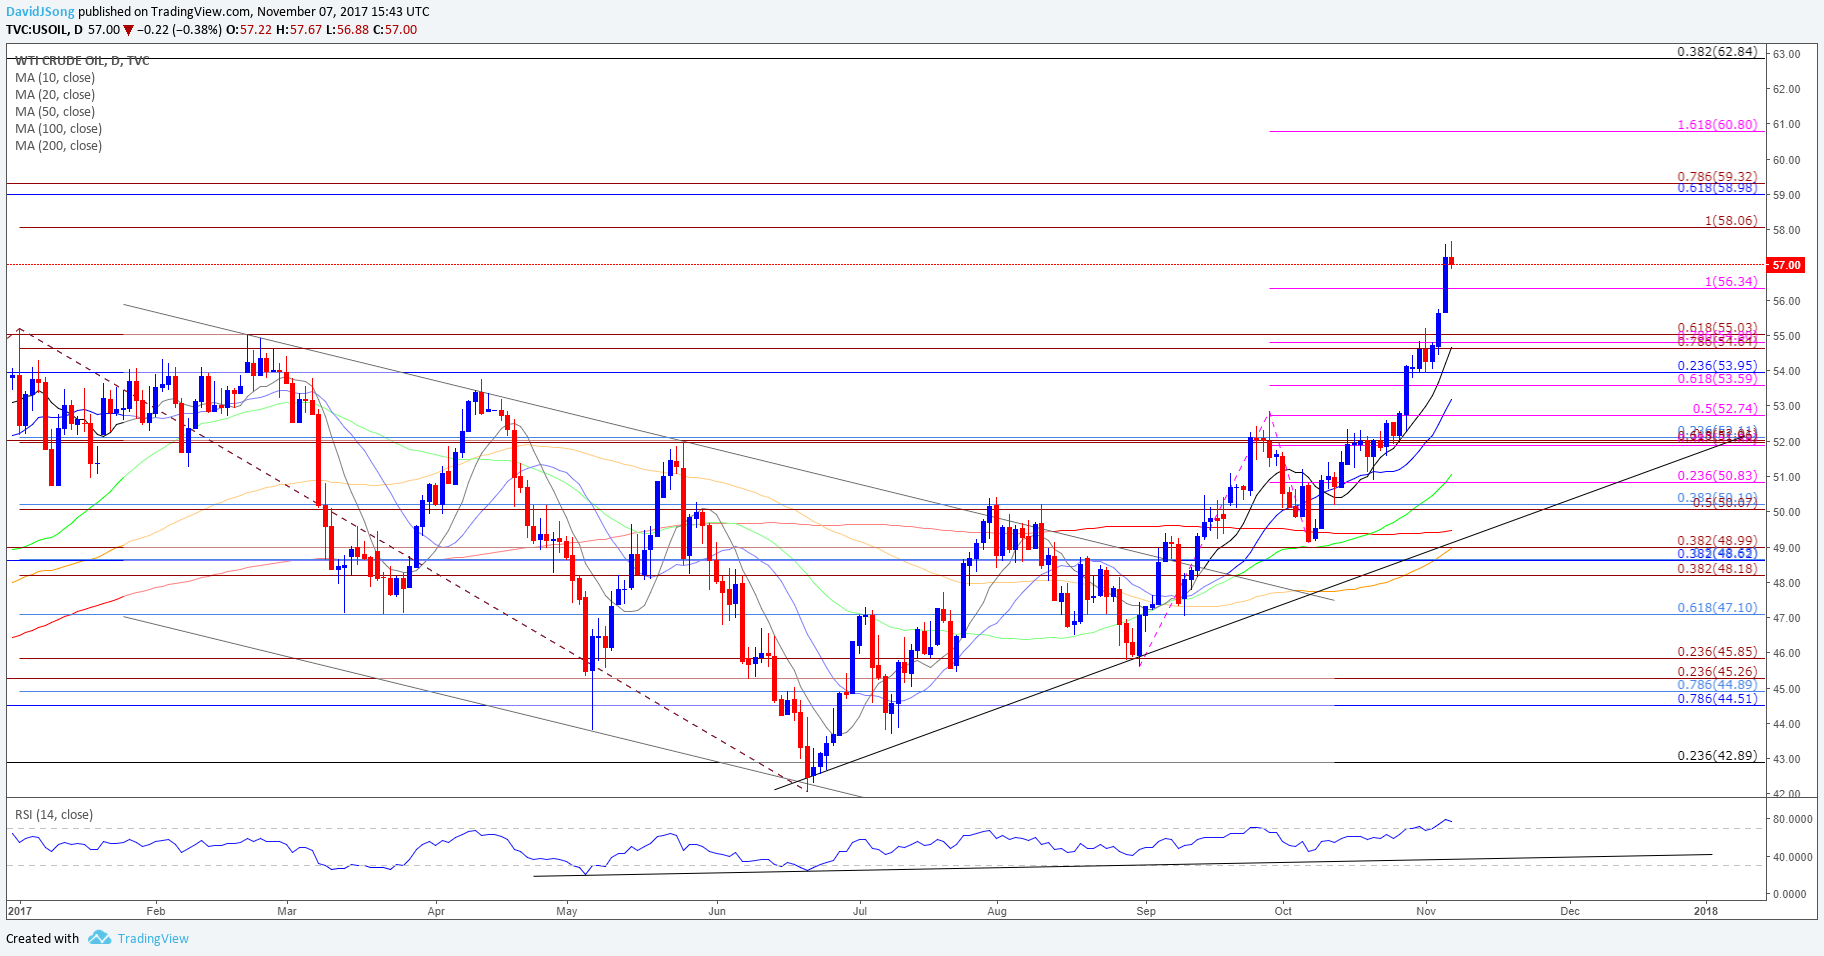
- Topside targets remain on the radar for USOIL as the Relative Strength Index (RSI) pushes into overbought territory for the first time in 2017, with crude at risk of extending the advance from the summer months as long as the momentum indicator holds above 70.
- A break/close above the $58.00 (100% expansion) handle opens up the next topside hurdle around $59.00 (61.8% retracement) to $59.30 (78.6% expansion) followed by the $60.80 (161.8% expansion) region.
- Broader look at the RSI encourages a constructive outlook for USOIL as it preserves the bullish formation carried over from May; need to see the oscillator fall below 70 to hint at a near-term correction, with the former-resistance zone around the former-resistance zone around $52.00 (50% expansion) to $52.10 (23.6% retracement) on the horizon.
AUD/USD struggles to retain the rebound from earlier this week as the Reserve Bank of Australia (RBA) sticks to the sidelines in November, and the pair may continue to give back the advance from earlier this year as the central bank appears to be on course to carry the record-low cash rate into 2018.
Recent comments from Governor Philip Lowe & Co. suggest the central bank is in no rush to normalize monetary policy as ‘household incomes are growing slowly and debt levels are high,’ and the board may continue to endorse a wait-and-see approach at its last 2017-meeting on December 5 as ‘inflation is likely to remain low for some time, reflecting the slow growth in labour costs and increased competitive pressures, especially in retailing.’
In turn, the RBA’s may utilize the quarterly monetary policy statement to tame expectations for higher borrowing-costs, with AUD/USD at risk of facing a more bearish fate going into the end of the year especially as the Federal Open Market Committee (FOMC) is widely anticipated to deliver a December rate-hike.
AUD/USD Daily Chart
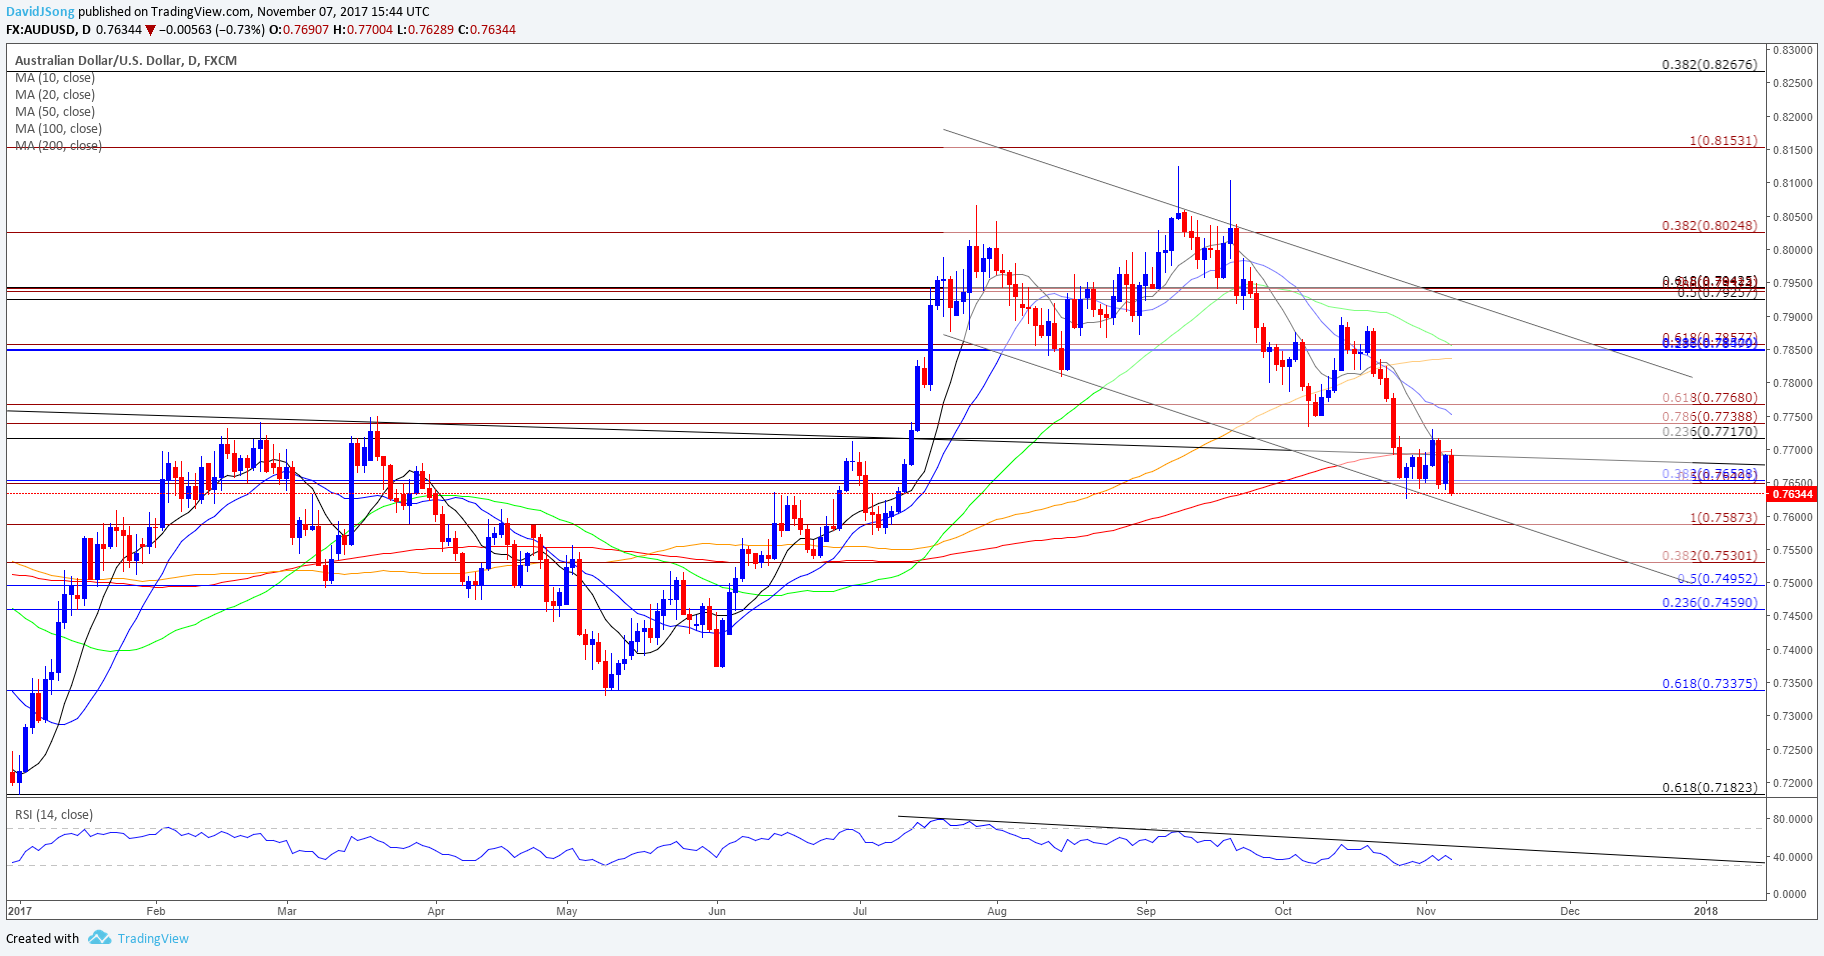
- With AUD/USD making another run at the October-low (0.7625), the monthly opening range remains in focus, with the next downside region of interest coming in around 0.7590 (100% expansion) followed by the Fibonacci overlap around 0.7460 (23.6% retracement) to 0.7530 (38.2% expansion).
- Even though AUD/USD sits at channel support, the failed attempt to push back above the former-support zone around 0.7720 (23.6% retracement) to 0.7770 (61.8% expansion) raises the risk for a further decline in the exchange rate especially as the Relative Strength Index (RSI) appears to be flattening out ahead of trendline resistance; may see AUD/USD extend the decline from September should the momentum indicator break below 30 for the first time in 2017.
For a broader discussion on current market themes, Sign up and join DailyFX Currency Analyst David Song LIVE for an opportunity to cover potential trade setups!
Click Here for the DailyFX Calendar
Interested in learning about more about popular trading indicators and tools? Download the DailyFX Advanced trading guides for FREE !
--- Written by David Song, Currency Analyst
To contact David, e-mail dsong@dailyfx.com. Follow me on Twitter at @DavidJSong.
To be added to David's e-mail distribution list, please follow this link.


