


Talking Points:
- USD/CAD Stages Larger Pullback Following Upbeat Canada Employment Report.
- Crude Oil Prices Struggle to Test 2017-High; U.S. Output Picks Up Ahead of OPEC Meeting.
The Canadian dollar outperforms its major counterparts following the above-forecast print for Canada Employment, with USD/CAD at risk for a larger correction as the ongoing improvement in the labor market puts pressure on the Bank of Canada (BoC) to further normalize monetary policy over the coming months.
Even though the headline reading increased 35.3K in October, the gains were led by an 88.7K expansion in full-time employment, with the labor force participation rate bouncing back to an annualized 65.7% from 65.6% the month prior. Signs of a tightening labor market may push the BoC to adopt a more hawkish tone as ‘the Bank estimates that the economy is operating close to its potential,’ and Governor Stephen Poloz and Co. may have little choice to prepare Canadian households and businesses for higher borrowing-costs as officials note ‘less monetary policy stimulus will likely be required over time.’
Keep in mind, the BoC may stick to the sidelines ahead of 2018 as ‘growth is expected to moderate to a more sustainable pace in the second half of 2017 and remain close to potential over the next two years,’ but the near-term advance in USD/CAD may continue to unravel should the key data prints coming out of Canada boost interest-rate expectations.
USD/CAD Daily Chart

- Downside targets are coming back on the radar for USD/CAD as the inverse head-and-shoulders formation appears to have run its course, with the Relative Strength Index (RSI) highlighting a similar dynamic as it finally falls back from overbought territory and snaps the bullish formation from September.
- The advance from the 2017-low (1.2061) may continue to unravel as USD/CAD fails to test the former-support zone around 1.2980 (61.8% retracement) to 1.3030 (50% expansion), with the fresh series of lower highs & lows raising the risk for a move back towards 1.2620 (50% retracement), which lines up with channel support.
- Next downside region of interest comes in around 1.2440 (23.6% expansion) to 1.2510 (78.6% retracement), which sits just above the October-low (1.2433).
Crude sits near the 2017-high ($55.21) even as U.S. output picks up in October, and oil prices may remain bid ahead of the Organization of the Petroleum Exporting Countries’ (OPEC) meeting on November 30 as the group and its allies pledge to extend their efforts in rebalancing the energy market.
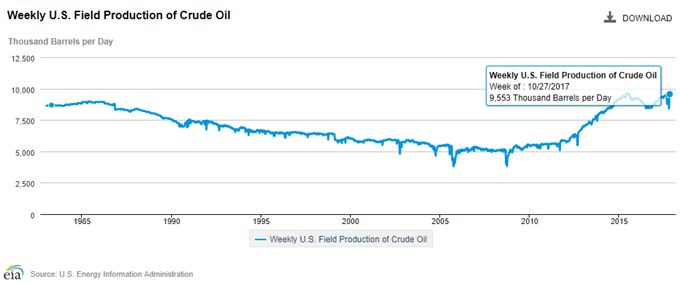
Despite the 2435K decline in U.S. oil inventories, field production continued to pick up in the week ending October 27, with output approaching the 2017-high (9,561). The ongoing recovery in U.S. productivity may put increased pressure on OPEC & Non-OPEC members to prolong their pact to curb supply especially as Saudi Arabia Oil Minister Khalid Al-Falih expects the coalition to ‘renew our resolve to return already improving global inventories to their normal levels.’
With that said, crude prices may stay bid over the near-term as both price and the Relative Strength Index (RSI) preserve the bullish trends carried over from the summer months. However, a string of failed attempt to break the January-high ($55.21) raises the risk for a near-term pullback as the bullish momentum appears to be tapering off.
USOIL Daily Chart

- Broader outlook for USOIL remains constructive, with the topside targets on the radar following the break/close above the former-resistance zone around $52.00 (50% expansion) to $52.10 (23.6% retracement).
- Keeping a close eye on the Relative Strength Index (RSI) as it flirts with overbought territory, but failure to hold above 70 may highlight a near-term exhaustion in USOIL.
- In turn, will need to pay close attention to the monthly opening range as USOIL comes up against the January-high ($55.21), with another failed attempt to break/close above the key hurdle around $54.60 (78.6% expansion) to $55.00 (61.8% expansion) raising the risk for a pullback in crude prices.
- First downside region of interest comes in around $53.60 (61.8% expansion) to $54.00 (23.6% retracement) followed by the $52.70 (50% expansion) region.
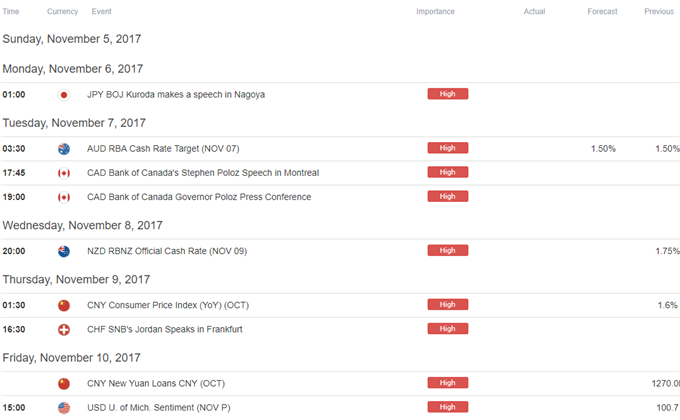
Click Here for the DailyFX Calendar
Want More Resources? Click Here to Download the FREE DailyFX Advanced Trading Guide!
--- Written by David Song, Currency Analyst
To contact David, e-mail dsong@dailyfx.com. Follow me on Twitter at @DavidJSong.
To be added to David's e-mail distribution list, please follow this link.


