


Talking Points:
- USD/JPY, Treasury Yields Hold Narrow Range Ahead of NFP Report.
- GBP/USD Continues to Search for Support; S&P Unconvinced by Hawkish BoE Rhetoric.
- Sign Up & Join the LIVE DailyFX Roundtable Non-Farm Payrolls Coverage.
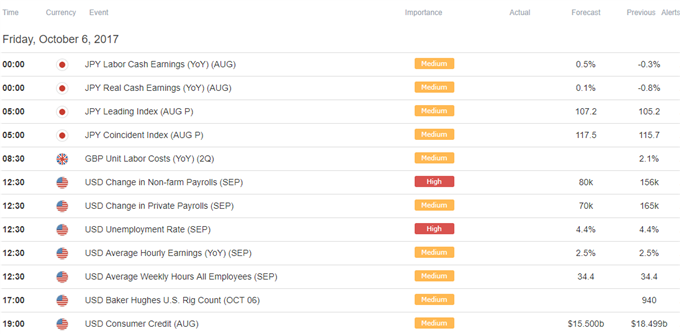
USD/JPY holds within the previous day’s range and the pair may continue to face a narrow range ahead of the Non-Farm Payrolls (NFP) report as the U.S. economy is anticipated to add another 80K jobs in September.
DailyFX 4Q 2017 Forecasts Are Now Available!
Despite the ongoing improvement in employment, market participants may pay increased attention to Average Hourly Earnings as the figure is anticipated to hold steady at an annualized 2.5% for the sixth consecutive month. Signs of little to no wage growth may ultimately dampen the appeal of the greenback and weigh on U.S. Treasury Yields as it encourages the Federal Reserve to implement a less aggressive normalization cycle. In turn, Chair Janet Yellen and Co. may merely try to buy more time at the October 30 interest rate decision, with the U.S. dollar at risk of facing a more bearish fate over the remainder of the year should Fed officials continue to trim the longer-run forecast for the benchmark interest rate.
USD/JPY Daily Chart
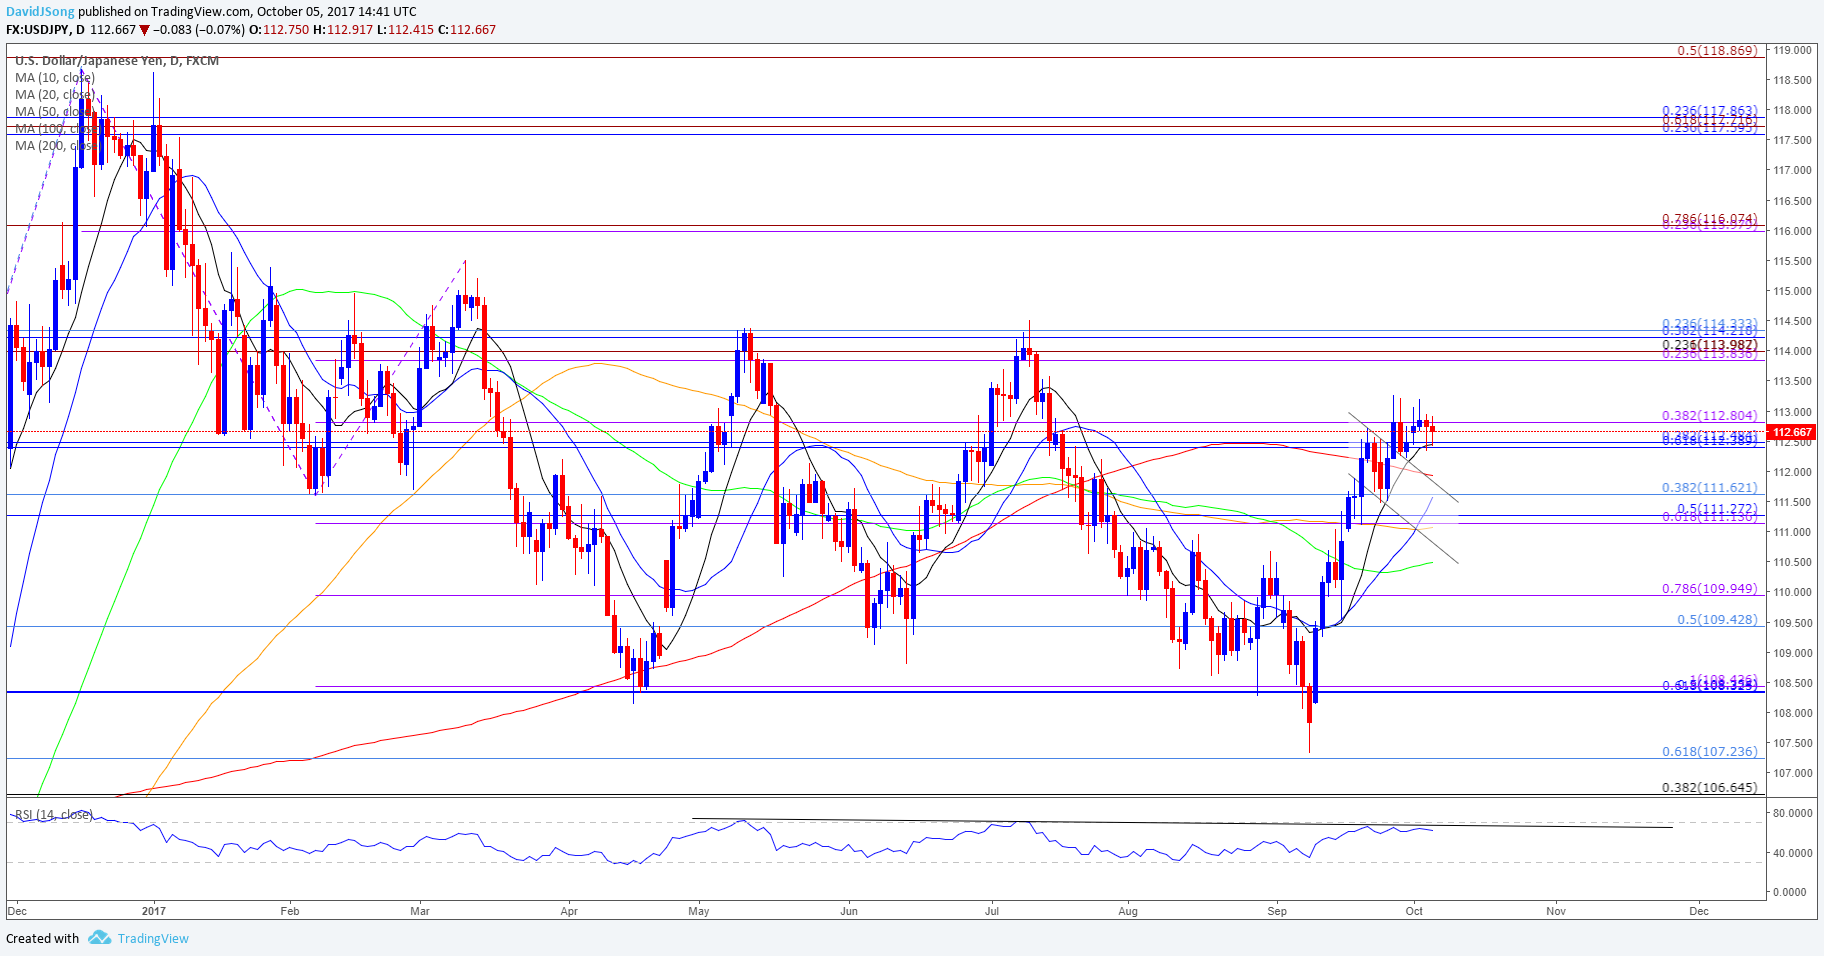
- USD/JPY remains at risk of extending the rebound from the September-low (107.32) as a bull-flag formation pans out, with the next topside hurdle coming in around 113.80 (23.6% expansion) to 114.30 (23.6% retracement), which sits just below the July-high (114.50).
- Nevertheless, the Relative Strength Index (RSI) appears to be confined by a bearish formation, with the lack of momentum to push into overbought territory raising the risk for a larger pullback in USD/JPY.
- Failure to preserve the monthly opening range may spur a move back towards the 200-Day SMA (111.93), with the next downside hurdle coming in around 111.10 (61.8% expansion) to 111.60 (38.2% retracement), the former-resistance zone.
The British Pound lags behind its major counterparts, with GBP/USD at risk of extending the decline from earlier this week as Standard & Poor’s Financial Services sees limited scope for higher U.K. borrowing costs.
Even though S&P warns the BoE may deliver a 25bp rate-hike in November, the rating-agency went onto say that it’s ‘a bit skeptical’ to justify higher interest rates as the current policy is ‘primarily aimed at propping up sterling to reduce imported inflation pressures.’ In response, Governor Mark Carney and Co. may continue to insist that ‘a withdrawal of part of the stimulus that the Committee had injected in August last year would help to moderate the inflation overshoot while leaving monetary policy very supportive,’ but the majority of BoE officials may endorse a wait-and-see approach for 2018 as the U.K.’s departure from the European Union (EU) clouds the economic outlook.
Nevertheless, fresh comments from Monetary Policy Committee (MPC) officials Ian McCafferty and Andrew Haldane may tame the recent weakness in the British Pound should the voting-members highlight a more material shift in the monetary policy outlook.
GBP/USD Daily Chart

Chart - Created Using Trading View
- Downside targets remain on the radar for GBP/USD as price and the Relative Strength Index (RSI) extend the bearish formations from the previous week, with the near-term outlook capped by the Fibonacci overlap around 1.3300 (100% expansion) to 1.3320 (38.2% retracement).
- Break/close below the Fibonacci overlap around 1.3090 (38.2% retracement) to 1.3120 (78.6% retracement) may spur a move at the 100-Day SMA (1.3015), with the next downside region of interest coming in around 1.2950 (23.6% expansion) to 1.2960 (78.6% retracement).
Retail Sentiment
Track Retail Sentiment with the New Gauge Developed by DailyFX Based on Trader Positioning
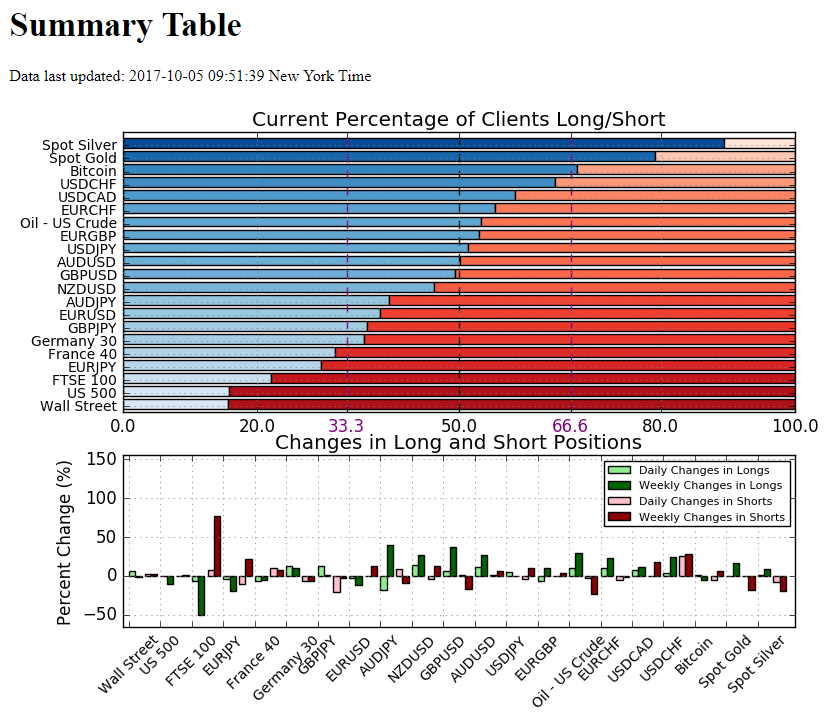
- Retail trader data shows 79.1% of traders are net-long Spot Gold with the ratio of traders long to short at 3.79 to 1. The number of traders net-long is 7.6% higher than yesterday and 16.4% higher from last week, while the number of traders net-short is 11.1% lower than yesterday and 25.8% lower from last week.
- Retail trader data shows 54.9% of traders are net-long USD/CAD with the ratio of traders long to short at 1.22 to 1. In fact, traders have remained net-long since June 07 when USD/CAD traded near 1.35087; price has moved 7.5% lower since then. The number of traders net-long is 10.8% lower than yesterday and 6.4% lower from last week, while the number of traders net-short is 16.5% higher than yesterday and 15.5% higher from last week.
Click Here for the DailyFX Calendar
--- Written by David Song, Currency Analyst
To contact David, e-mail dsong@dailyfx.com. Follow me on Twitter at @DavidJSong.
To be added to David's e-mail distribution list, please follow this link.


