


Talking Points:
- Crude Oil Prices Carve Bullish Sequence Following Harvey; Outlook Mired by Rising U.S. Output.
- AUD/USD Bid Amid Dovish Fed Rhetoric- Australia 2Q GDP Report in Focus.
- Sign Up for the DailyFX Trading Webinars for an opportunity to discuss potential trade setups.

| Ticker | Last | High | Low | Daily Change ($) | Daily Range ($) |
|---|---|---|---|---|---|
| USOIL | 48.87 | 48.90 | 47.33 | 1.51 | 1.57 |
Crude trades on a firmer footing following Hurricane Harvey, with oil prices at risk of a staging a larger recovery as they initiate a series of higher highs & lows.
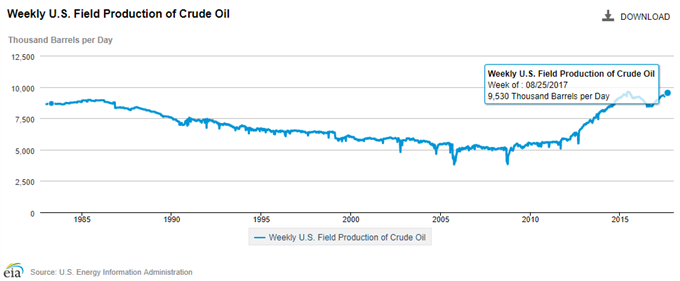
WTI may continue to retrace the decline from the previous month as U.S. refineries gradually coming back online and fire up the production cycle, but the ongoing rise in crude oil output continues dampen the broader outlook as fresh updates coming out of the Energy Information Administration (EIA) shows field production hitting fresh 2017-highs.
For Additional Resources, Download the DailyFX Trading Guides and Forecasts
Weekly U.S. crude outputs climbed to 9,530K b/d in the week ending August 25, with the figure quickly approaching the record-high (9,610 b/d). At the same time, Moody's Investors Service noted that ‘the stable outlook for the global oilfield services (OFS) sector reflects our view that the worst is now behind us and we are in the early stages of a cyclical recovery,’ with the group going onto say that ‘expect industry earnings to grow 6%-8% in 2017 and more substantially next year, given improved prospects for commodity prices and higher upstream spending.’
In turn, efforts by the Organization of the Petroleum Exporting Countries (OPEC) to rebalance the energy market may ultimately fail to have a longer-term influence on oil prices amid the ongoing expansion in global production.
USOIL Daily Chart

Chart - Created Using Trading View
- Broader outlook for USOIL remains tilted to the downside as it preserves the downward trend carried over from earlier this year, but crude may continue to threaten the bearish formation as it works its way back towards the top of the channel.
- At the same time, the Relative Strength Index (RSI) flashes a bullish trigger as it breaks out of the downward trend carried over from the previous month, and a material shift in market behavior could be under way as an inverse head-and-shoulders formation appears to be taking shape.
- In turn, a move back above the Fibonacci overlap around $48.60 (38.2% retracement) to $49.30 (23.6% retracement) may open up the $50.20 (38.2% retracement) hurdle, which sits just below the August-high ($50.40), with the next region of interest coming in around $52.00 (50% expansion) to $52.10 (23.6% retracement).
| Ticker | Last | High | Low | Daily Change ($) | Daily Range ($) |
|---|---|---|---|---|---|
| AUD/USD | 0.8017 | 0.8028 | 0.7942 | 73 | 86 |
AUD/USD pushes to fresh monthly-highs as Fed Governor Lael Brainard adopts a cautious tone and warns the Federal Open Market Committee (FOMC) ‘should be cautious about tightening policy further until we are confident inflation is on track to achieve our target.’
The fresh remarks from the permanent voting-member suggest the FOMC will stick to wait-and-see approach at the September 20 interest rate decision, and Chair Janet Yellen and Co. may project a more shallow path for the Fed Funds rate as the central bank struggles to achieve the 2% target for inflation. As a result, the U.S. dollar may continue to exhibit a bearish behavior over the coming months as market participants scale back bets for three rate-hikes in 2017.
At the same time, the Reserve Bank of Australia (RBA) appears to be in no rush to remove the record-low cash rate as the central bank warns ‘slow growth in real wages and high levels of household debt are likely to constrain future growth in spending.’ Moreover, the resilience in the Australian dollar may encourage Governor Philip Lowe and Co. to carry the current policy into 2018 as ‘an appreciating exchange rate would be expected to result in a slower pick-up in economic activity and inflation than currently forecast.’
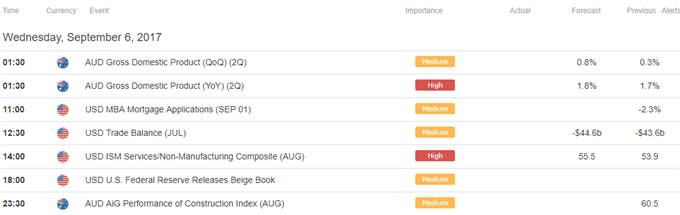
Nevertheless, Australia’s 2Q Gross Domestic Product (GDP) report may generate a bullish reaction in AUD/USD as the growth rate is expected to increase an annualized 1.9%, but a lackluster print may tame the near-term advance in the exchange rate as the RBA continues to toughen the verbal intervention on the local currency.
AUD/USD Daily Chart
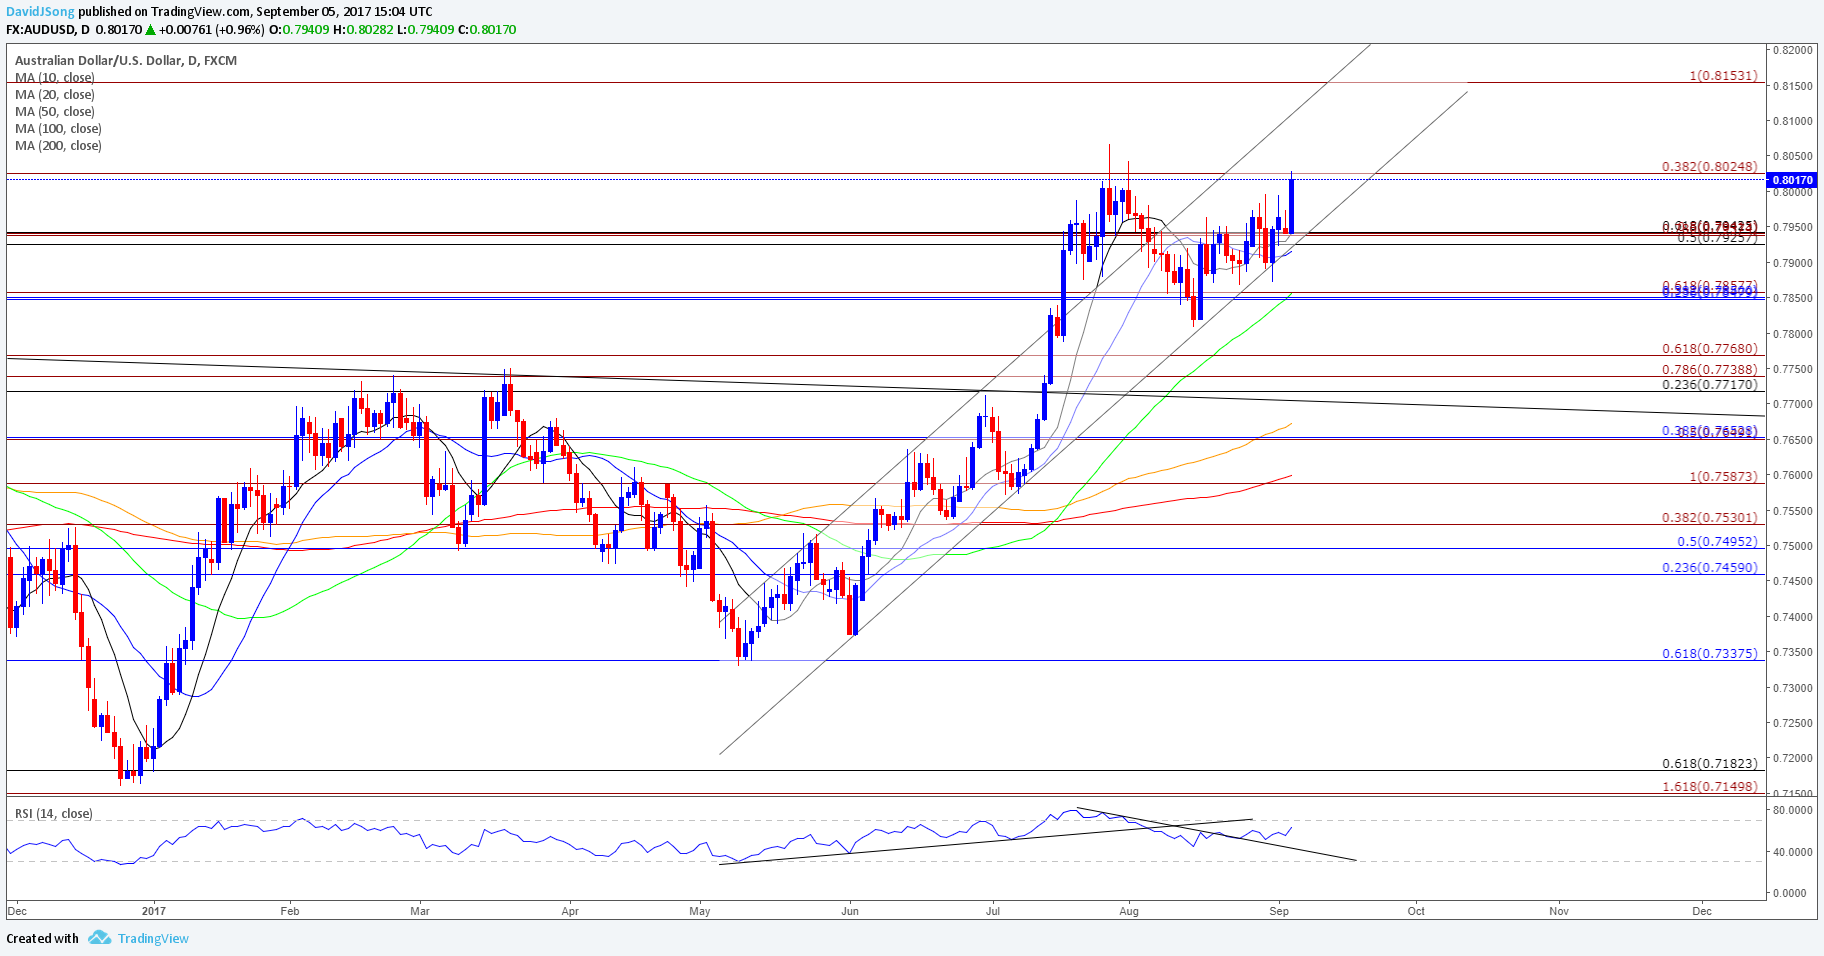
Chart - Created Using Trading View
- AUD/USD stands at risk of facing range-bound conditions as it struggles to test the 2017-high (0.8066), with a failed attempt to close above the 0.8020 (38.2% retracement) hurdle raising the risk for a near-term pullback in the exchange rate.
- In turn, a move below the 0.7930 (50% retracement) to 0.7940 (61.8% retracement) region may open up the near-term support zone around 0.7850 (38.2% retracement) to 0.7860 (61.8% expansion), with next downside hurdle coming in around 0.7720 (23.6% retracement) to 0.7770 (61.8% expansion), the former-resistance zone.
Retail Sentiment

Track Retail Sentiment with the New Gauge Developed by DailyFX Based on Trader Positioning
- Retail trader data shows 63.9% of traders are net-long with the ratio of traders long to short at 1.77 to 1. In fact, traders have remained net-long since August 14 when Oil - US Crude traded near 4894.0; price has moved 0.1% higher since then. The percentage of traders net-long is now its lowest since August 24 when it traded near 4779.0. The number of traders net-long is 4.9% lower than yesterday and 18.1% lower from last week, while the number of traders net-short is 7.3% higher than yesterday and 20.4% higher from last week.
- Retail trader data shows 29.9% of traders are net-long with the ratio of traders short to long at 2.35 to 1. In fact, traders have remained net-short since June 04 when AUD/USD traded near 0.74707; price has moved 7.4% higher since then. The number of traders net-long is 0.3% lower than yesterday and 9.4% lower from last week, while the number of traders net-short is 10.8% higher than yesterday and 15.0% higher from last week.
Click Here for the DailyFX Calendar
--- Written by David Song, Currency Analyst
To contact David, e-mail dsong@dailyfx.com. Follow me on Twitter at @DavidJSong.
To be added to David's e-mail distribution list, please follow this link.


