


Talking Points:
- USD/CAD Bear-Flag Unfolds Ahead of Fed Economic Symposium in Jackson Hole.
- JPN225 Threatens 2016 Trend, Eyes 200-Day SMA Again as Risk Sentiment Wanes.
- Sign Up for the DailyFX Trading Webinars for an opportunity to discuss potential trade setups.
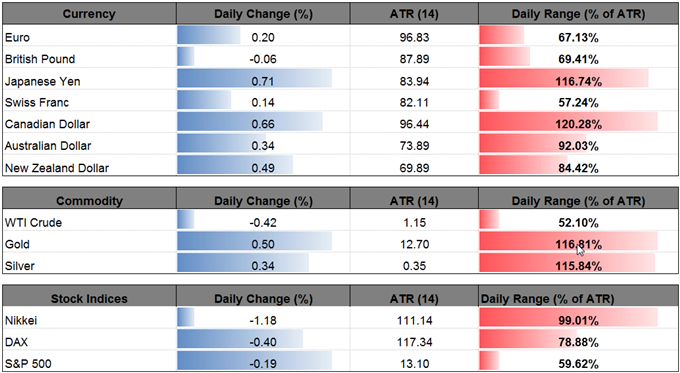
| Ticker | Last | High | Low | Daily Change (pip) | Daily Range (pip) |
|---|---|---|---|---|---|
| USD/CAD | 1.2602 | 1.2691 | 1.2675 | 80 | 116 |
USD/CAD extends the decline from earlier this week as Canada’s Consumer Price Index (CPI) picks up for the first time since January, and the pair may continue to give back the rebound from the July-low (1.2413) as a continuation pattern takes shape.
Signs of rising price pressures may encourage the Bank of Canada (BoC) to further normalize monetary policy in 2017, and the central bank mayprepare Canadian households and businesses for higher borrowing-costs at the next meeting on September 6 as ‘the factors behind soft inflation appear to be mostly temporary.’ In turn, the shift in USD/CAD behavior may continue to unfold in the second-half of the year, and Governor Stephen Poloz and Co. may adopt a more hawkish tone over the coming months as ‘the output gap is now projected to close around the end of 2017, earlier than the Bank anticipated in its April Monetary Policy Report (MPR).’
Nevertheless, the Fed Economic Symposium in Jackson Hole, Wyoming may impact the near-term outlook for USD/CAD as Chair Janet Yellen is schedule to speak next week, and the fresh remarks may boost the appeal of the greenback should the central bank head show a greater willingness to gradually remove the quantitative easing (QE) program over the coming months.
USD/CAD Daily Chart
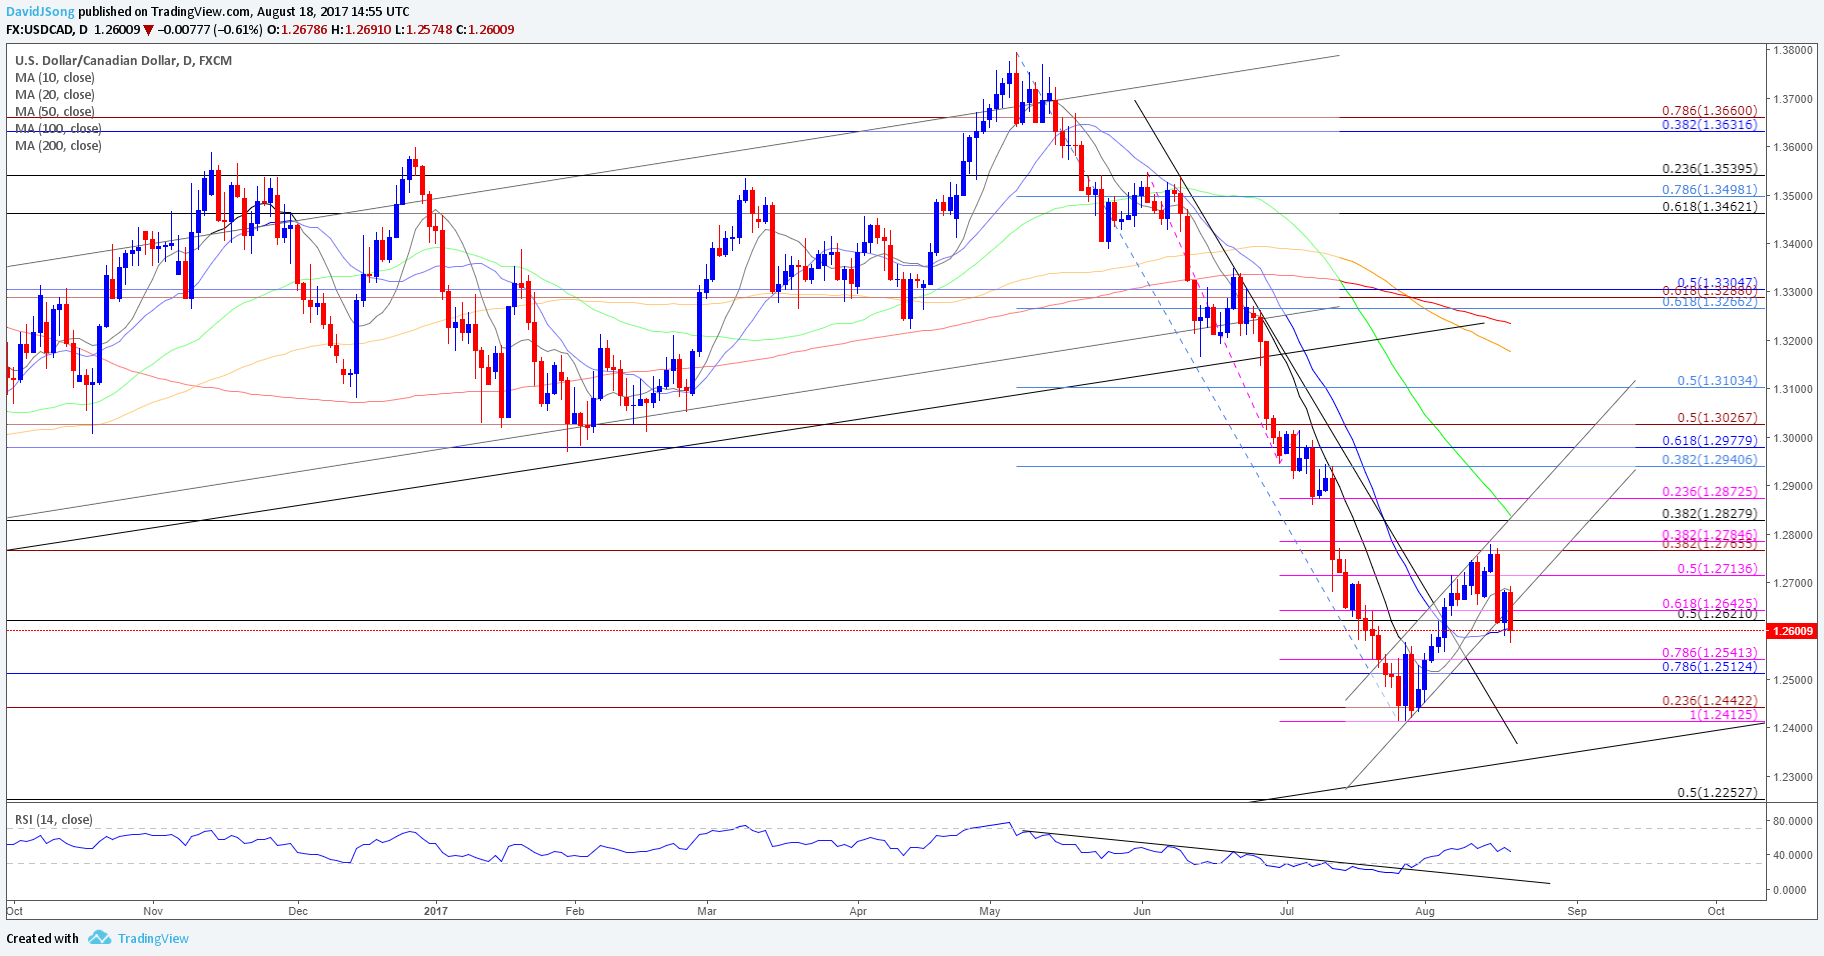
Chart - Created Using Trading View
- USD/CAD stands at risk for further losses as it continues to pullback from the former-support zone around 1.2770 (38.2% expansion) to 1.2780 (38.2% expansion) and fails to preserve the upward trend from the July-low (1.2413).
- Downside targets are back in focus as a bear-flag unfolds, with another close below the 1.2620 (50% retracement) to 1.2640 (61.8% expansion) region raising the risk for a move back towards the Fibonacci overlap around 1.2510 (78.6% retracement) to 1.2540 (61.8% expansion); next region of interest comes in around 1.2410 (100% expansion) to 1.2440 (23.6% expansion), which lines up with the 2017-low (1.2413).
| Ticker | Last | High | Low | Daily Change | Daily Range |
|---|---|---|---|---|---|
| JPN225 | 19372 | 19536 | 19325 | 119 | 211 |
The Nikkei quickly approaches the August-low (19,308), with the benchmark equity index at risk for a further decline as it snaps the bullish sequence from earlier this month.
For Additional Resources, Download the DailyFX Trading Guides and Forecasts
The terror attack in Barcelona, Spain appears to be weighing on market sentiment, and growing concerns surrounding the global economy may continue to sap risk appetite especially as the U.S. stands at risk of hitting the debt ceiling in late-September. In turn, the Nikkei, along with its major counterparts, may exhibit a more bearish behavior over the remainder of the year as the benchmark equity index threatens the upward trend carried over from 2016.
JPN225 Daily Chart
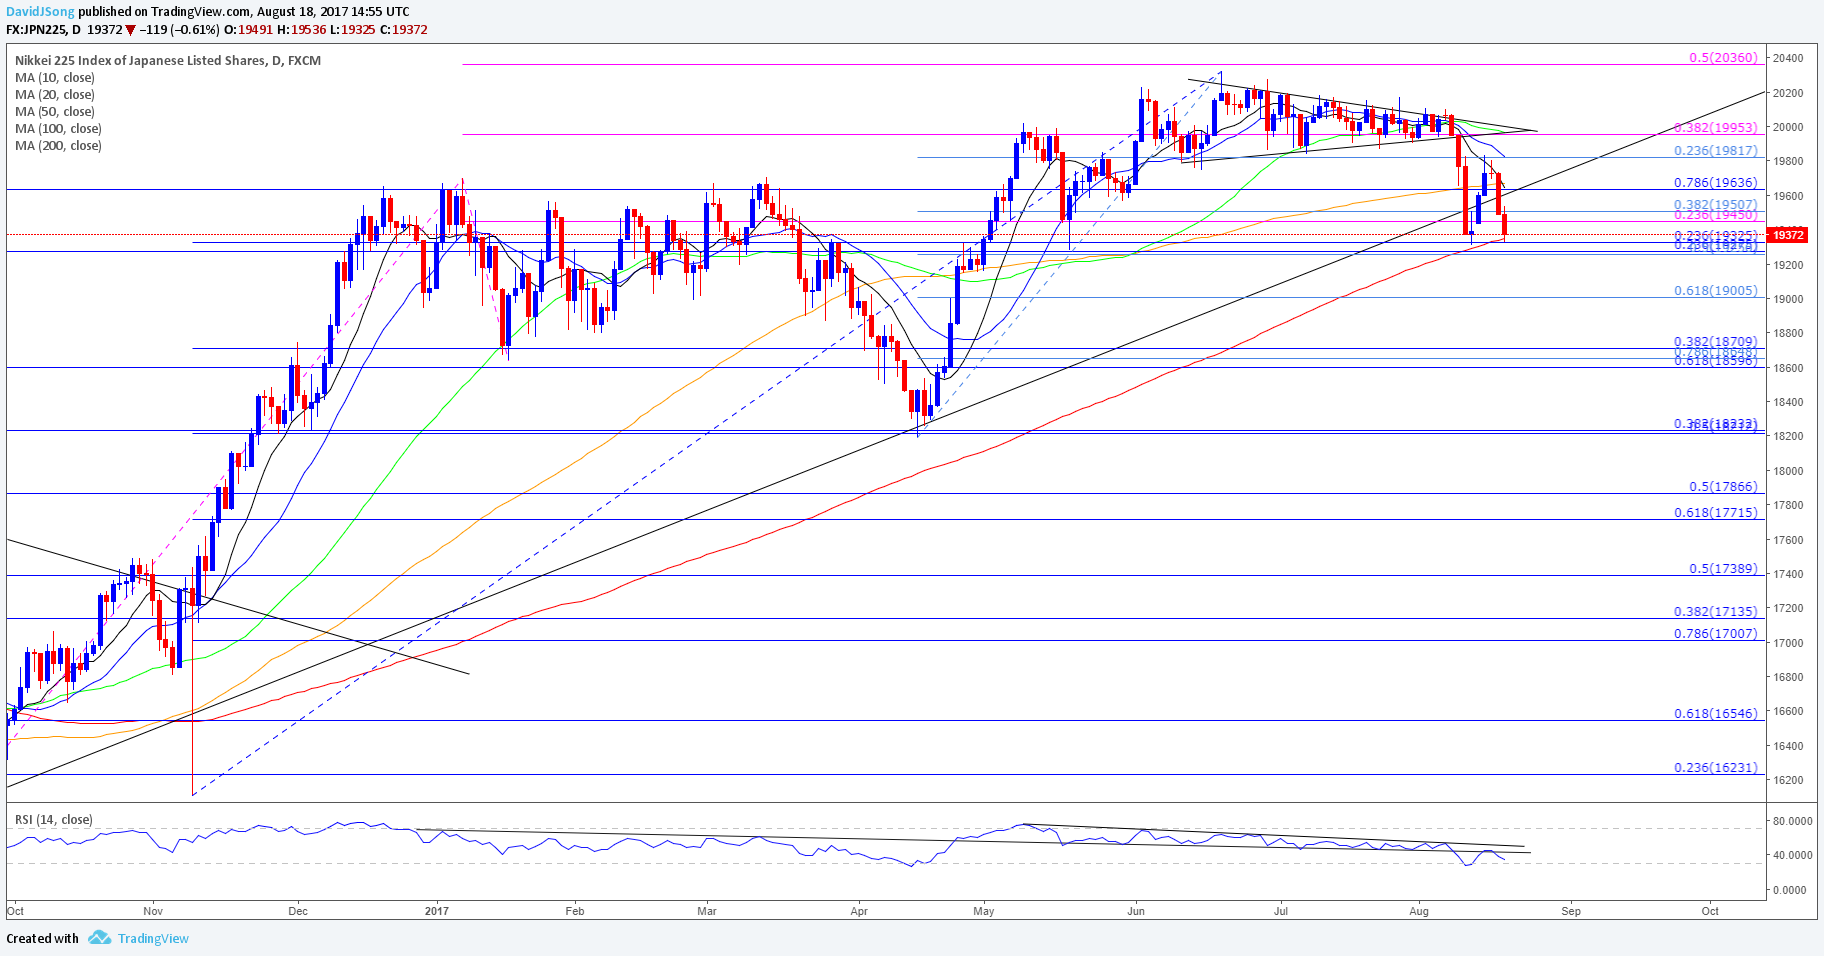
Chart - Created Using Trading View
- Downside targets are back on the radar for JPN225 as the near-term rebound stalls ahead of the former-support zone around 19,950 (38.2% expansion), with the Nikkei starting to carve a series of lower highs & lows; at the same time, the Relative Strength Index (RSI) turns around ahead of trendline resistance and largely preserves the bearish formation from May.
- May see a more meaningful run at the 200-Day SMA (19,350), which lines up with the Fibonacci overlap around 19,280 (23.6% retracement) to 19,330 (23.6% retracement), with the next downside region of interest coming in around the 19,000 (61.8% retracement) handle, followed by the 18,600 (61.8% retracement) to 18,710 (38.2% retracement) zone.
Retail Sentiment

Track Retail Sentiment with the New Gauge Developed by DailyFX Based on Trader Positioning
- Retail trader data shows 60.9% of traders are net-long USD/CAD with the ratio of traders long to short at 1.56 to 1. In fact, traders have remained net-long since June 07 when USD/CAD traded near 1.34477; price has moved 6.3% lower since then. The number of traders net-long is 8.1% lower than yesterday and 24.6% lower from last week, while the number of traders net-short is 21.6% higher than yesterday and 56.6% higher from last week.
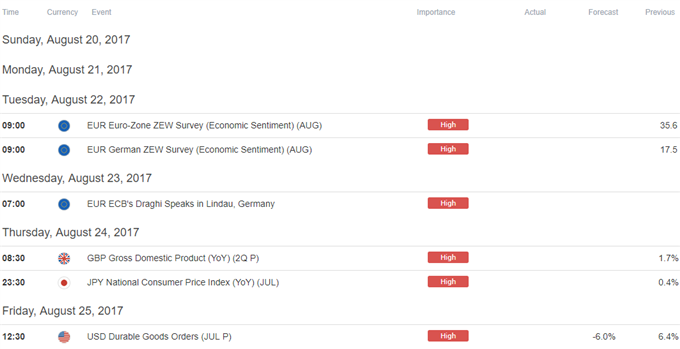
Click Here for the DailyFX Calendar
--- Written by David Song, Currency Analyst
To contact David, e-mail dsong@dailyfx.com. Follow me on Twitter at @DavidJSong.
To be added to David's e-mail distribution list, please follow this link.


