


Talking Points:
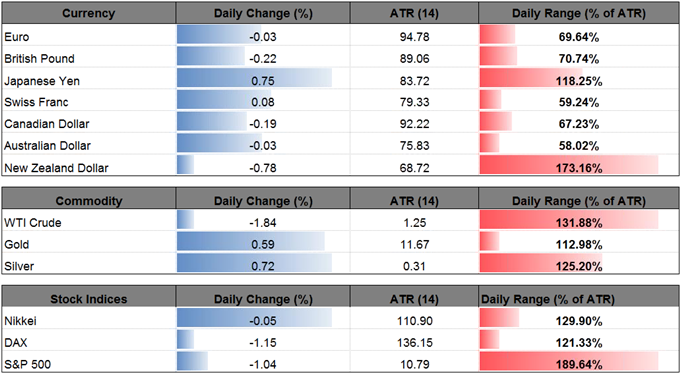
- Oil Prices Capped by August Opening Range, U.S. Outputs Hold Near 2017 High.
- NZD/USD: Bearish RSI Trigger Unfolds as RBNZ Notes ‘Subtle Change’ in Verbal Intervention.
- Sign Up for the DailyFX Trading Webinars for an opportunity to discuss potential trade setups.
| Ticker | Last | High | Low | Daily Change ($) | Daily Range ($) |
|---|---|---|---|---|---|
| USOIL | 48.67 | 50.20 | 48.55 | 0.99 | 1.65 |
USOIL climbed to a fresh weekly high ($50.20) as the Organization of the Petroleum Exporting Countries (OPEC) raised its outlook for global demand and plans to strengthen its commitment to curb production, but crude oil prices stand at risk of giving back the rebound from the June-low ($42.08) amid the lack of momentum to test the monthly opening range.
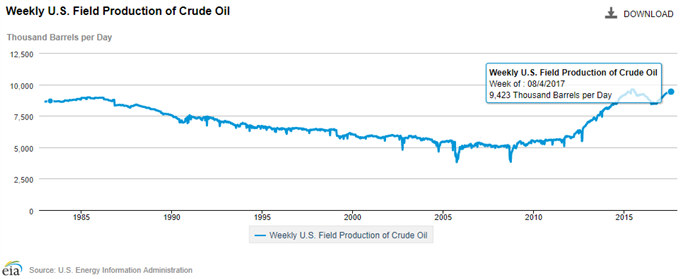
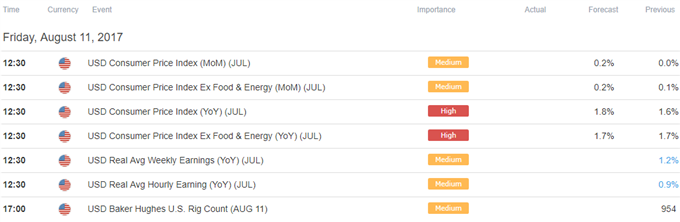
Even though oil inventories narrowed another 6451K barrels in the week ending August 4, separate figures coming out of the U.S. Energy Information Administration (EIA) showed crude production remains elevated, with field outputs holding near the 2017-high (9,430). In turn, oil prices may continue to operate within the downward trending channel carried over from earlier this year amid the resilience in U.S. production.
USOIL Daily Chart
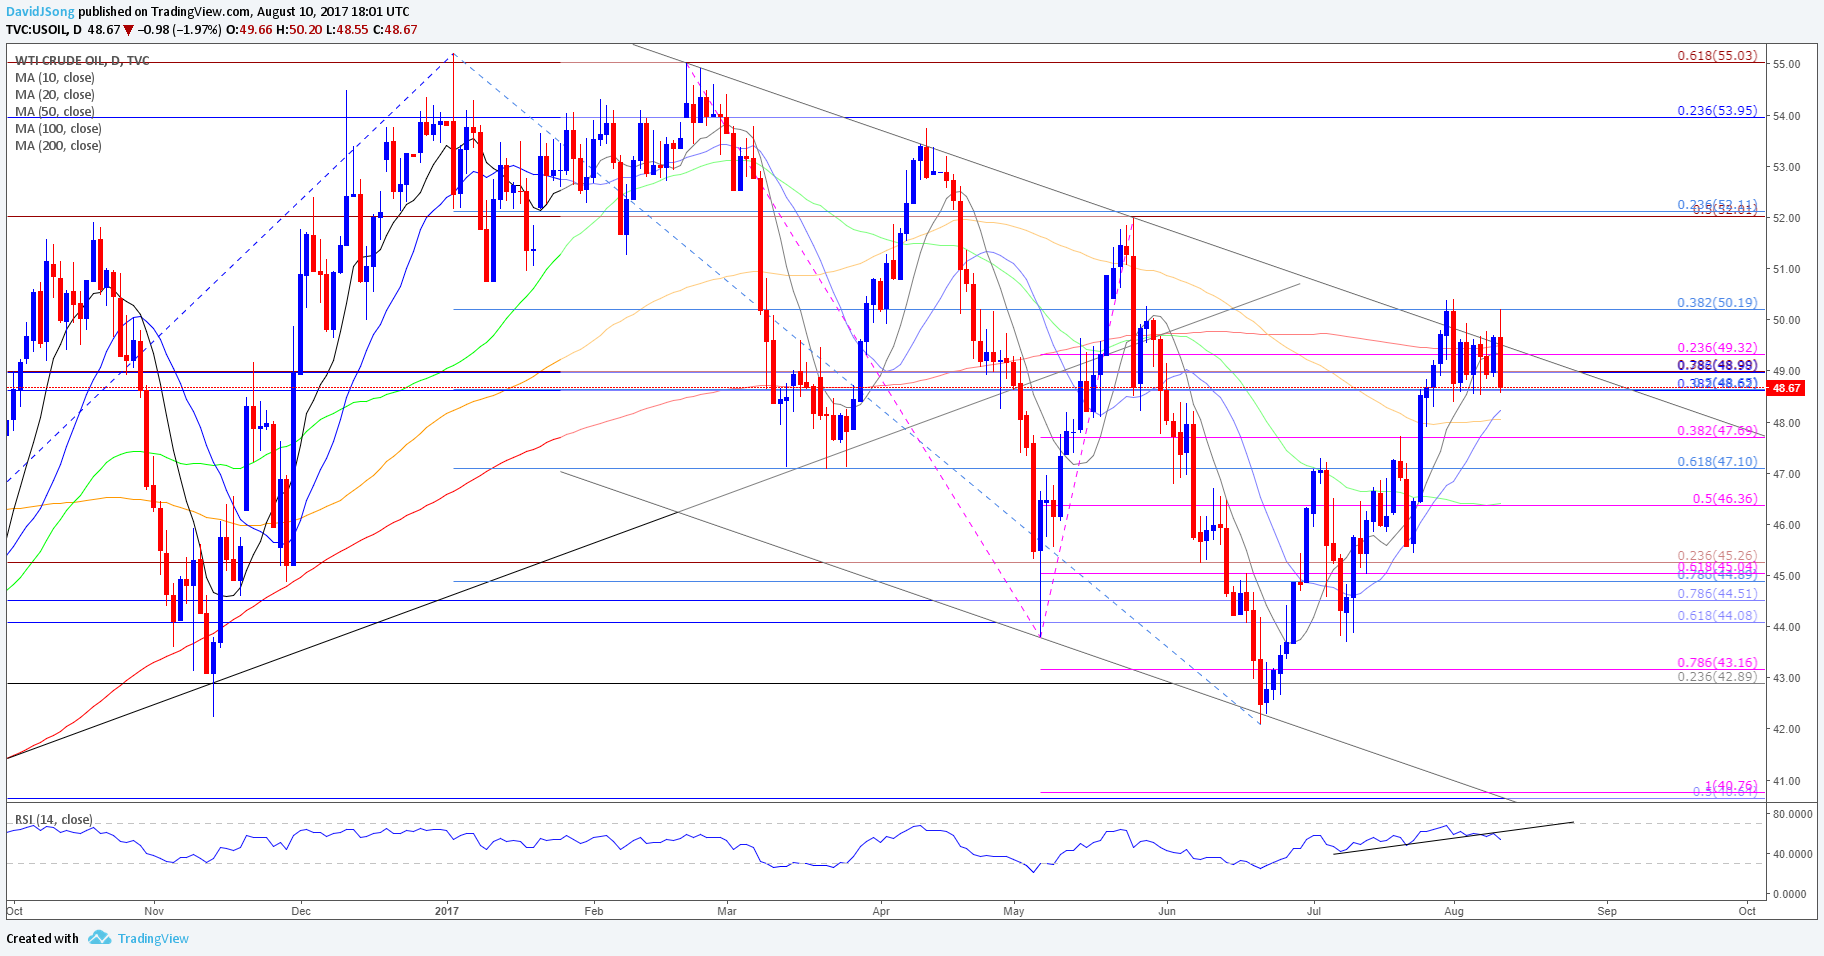
Chart - Created Using Trading View
- The rebound from the June-low ($42.08) may unravel amid the lack of momentum to test the August-high ($50.40), and USOIL may exhibit a more bearish behavior over the days ahead especially as the Relative Strength Index (RSI) struggles to retain the upward trend carried over from the previous month.
- In turn, a break/close below the $46.60 (38.2% retracement) may spur a move back towards $47.70 (38.2% expansion), with the next region of interest coming in around $47.10 (61.8% retracement).
| Ticker | Last | High | Low | Daily Change (pip) | Daily Range (pip) |
|---|---|---|---|---|---|
| NZD/USD | 0.7280 | 0.7371 | 0.7252 | 57 | 119 |
NZD/USD extends the decline from earlier this month as the Reserve Bank of New Zealand (RBNZ) points to a ‘subtle change’ in the verbal intervention, and the pair may face a more bearish fate over the near-term as ‘a lower New Zealand dollar is needed to increase tradables inflation and help deliver more balanced growth.’
For Additional Resources, Download the DailyFX Trading Guides and Forecasts
Governor Graeme Wheeler warned the RBNZ has ‘intervention capability’ as the resilience in the New Zealand dollar dampens the economic outlook for the export-driven economy, and the central bank may continue to ramp up its efforts to talk down kiwi as Assistant Governor John McDermott warns the local currency needs to 'adjust down.’ Even though the RBNZ notes that the appreciation is ‘driven in part by low global interest rates relative to those in New Zealand and higher export prices,’ it seems as though the Governor Wheeler and Co. are becoming less tolerant of the strength in NZD/USD as ‘core inflation measures are consistent with the subdued domestic inflationary pressure.’
NZD/USD Daily Chart

Chart - Created Using Trading View
- Failure to hold above the former-resistance zone around 0.7330 (38.2% retracement) to 0.7350 (23.6% expansion) keeps the near-term bias tilted to the downside, with NZD/USD at risk for further losses as it extends the series of lower lows from earlier this week.
- At the same time, the Relative Strength Index (RSI) appears to be flashing a bearish signal as it threatens the upward trend from March, with a break/close below the 0.7240 (61.8% retracement) to 0.7280 (61.8% retracement) region opening up the next region of interest around 0.7190 (50% retracement) to 0.7200 (38.2% retracement).
Retail Sentiment

Track Retail Sentiment with the New Gauge Developed by DailyFX Based on Trader Positioning
- US Crude: Retail trader data shows 45.3% of traders are net-long US Crude with the ratio of traders short to long at 1.21 to 1. In fact, traders have remained net-short since July 26 when Oil - US Crude traded near 4837.4; price has moved 1.1% higher since then. The number of traders net-long is 3.2% higher than yesterday and 1.5% higher from last week, while the number of traders net-short is 5.4% lower than yesterday and 12.1% lower from last week.
- Retail trader data shows 29.8% of traders are net-long NZD/USD with the ratio of traders short to long at 2.35 to 1. In fact, traders have remained net-short since May 24 when NZD/USD traded near 0.68562; price has moved 6.2% higher since then. The number of traders net-long is 7.1% higher than yesterday and 7.8% higher from last week, while the number of traders net-short is 14.0% lower than yesterday and 18.0% lower from last week.
Click Here for the DailyFX Calendar
--- Written by David Song, Currency Analyst
To contact David, e-mail dsong@dailyfx.com. Follow me on Twitter at @DavidJSong.
To be added to David's e-mail distribution list, please follow this link.


