


Talking Points:
- USD/JPY August Opening Range Remains Intact For Now; NFP Report to Reveal Subdued Wages.
- GBP/USD Recovery Stalls, RSI Turns Over as BoE Cuts Growth Forecast.
- DailyFX 3Q Forecasts Are Now Available.
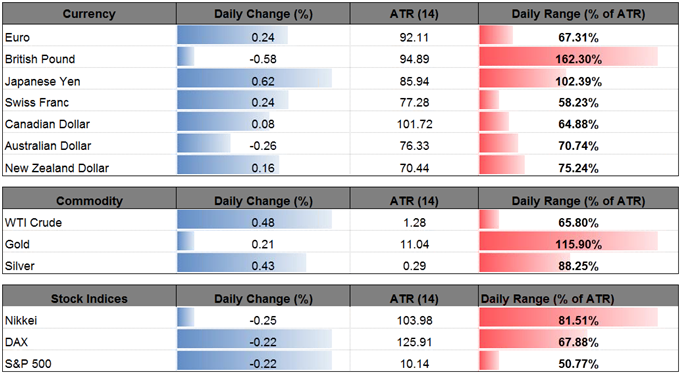
| Ticker | Last | High | Low | Daily Change (pip) | Daily Range (pip) |
|---|---|---|---|---|---|
| USD/JPY | 110.05 | 110.83 | 109.95 | 67 | 88 |
USD/JPY may face range-bound conditions ahead of the highly anticipated U.S. Non-Farm Payrolls (NFP) report as the pair fails to break the August-low (109.92).
With the fresh figures anticipated to show the U.S. economy adding another 180K jobs in July, a positive development may spark a bullish reaction in the dollar as it encourages the Federal Open Market Committee (FOMC) to further normalize monetary policy in the second-half of 2017. However, a slowdown in Average Hourly Earnings may dampen the appeal of the greenback and drag on U.S. Treasury Yields as ‘overall inflation and the measure excluding food and energy prices have declined and are running below 2 percent.’
Even though the USD/JPY snaps the bearish sequence carried over from the end of July, a series of lackluster data prints may generate further decline in the exchange rate as Fed Fund Futures largely show a 50/50 chance for a December rate-hike.
USD/JPY Daily Chart
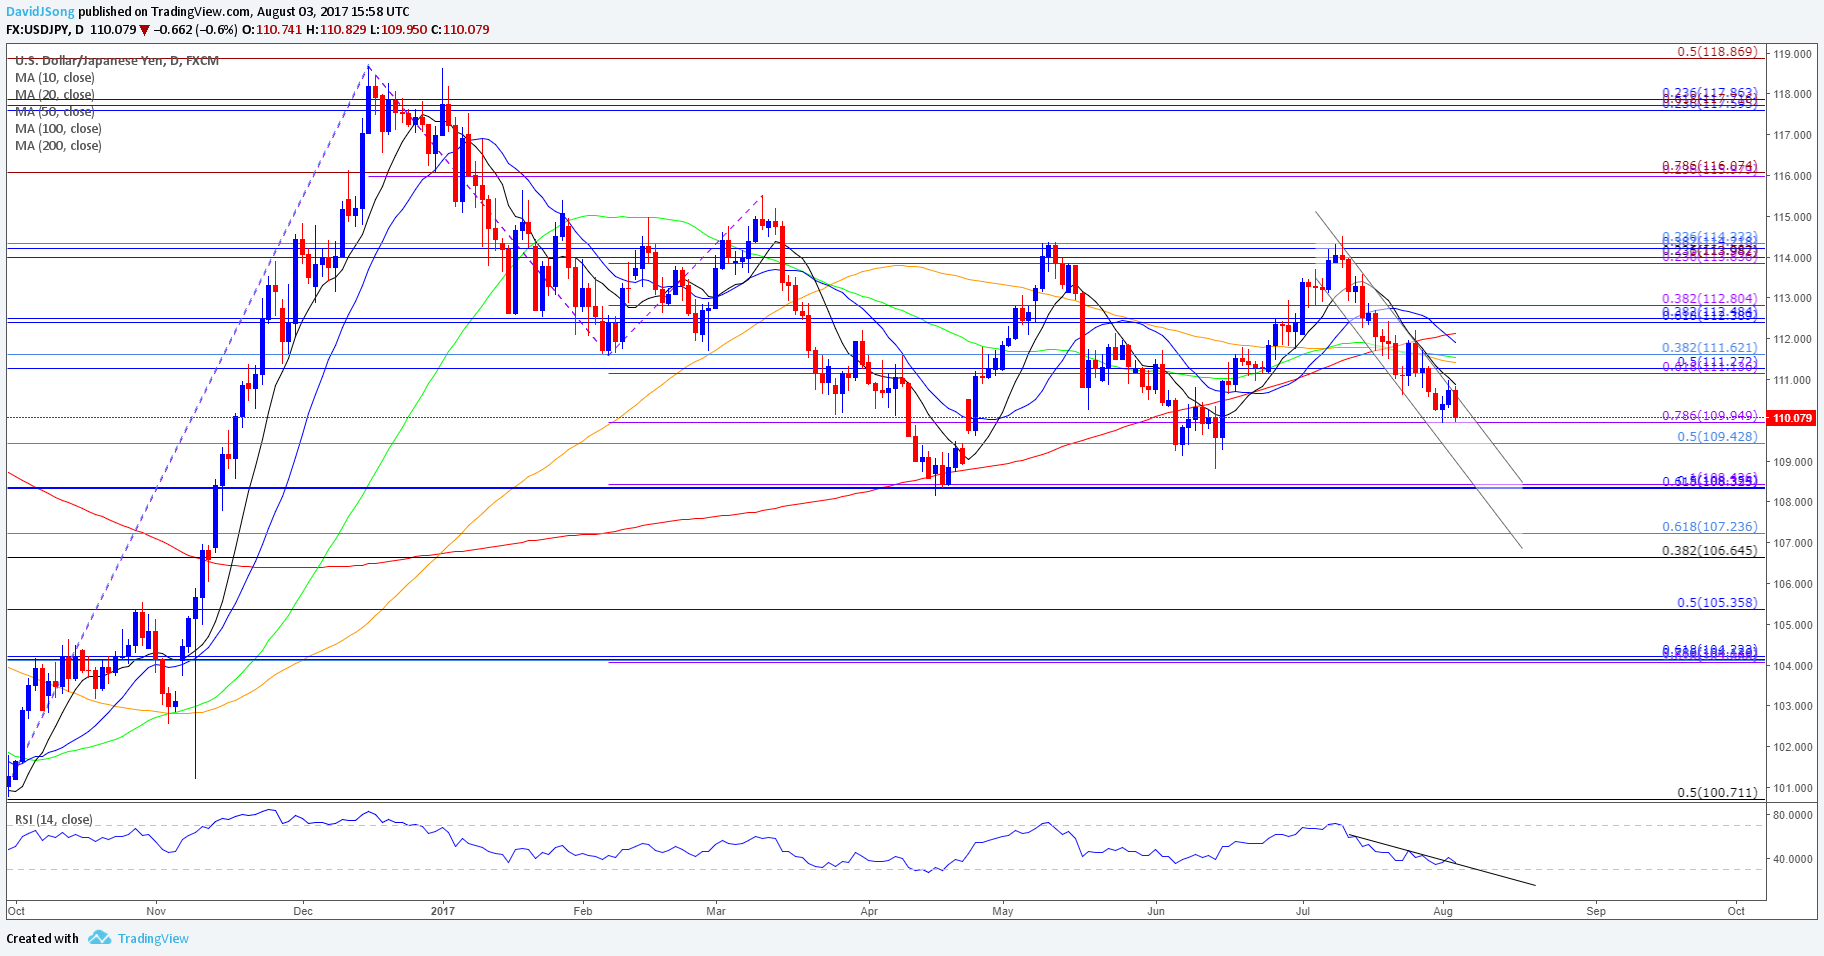
Chart - Created Using Trading View
- May see USD/JPY make a more meaningful run at the June-low (108.80) on a break/close below the near-term hurdle around 109.40 (50% retracement) to 109.90 (78.6% expansion) as the pair continues to operate within the downward trending channel carried over from the previous month.
- However, the Relative Strength Index (RSI) appears to be turning around ahead of oversold territory as it threatens the bearish formation, and the price action from June may recur, with the lack of momentum to clear the 109.40 (50% retracement) hurdle raising the risk for a move back towards 111.10 (61.8% expansion) to 111.60 (38.2% retracement).
| Ticker | Last | High | Low | Daily Change (pip) | Daily Range (pip) |
|---|---|---|---|---|---|
| GBP/USD | 1.3146 | 1.3267 | 1.3113 | 77 | 154 |
GBP/USD stands at risk for further losses as the Bank of England (BoE) votes 6-2 to preserve the record-low interest rate and cuts the growth forecast for the U.K. economy.
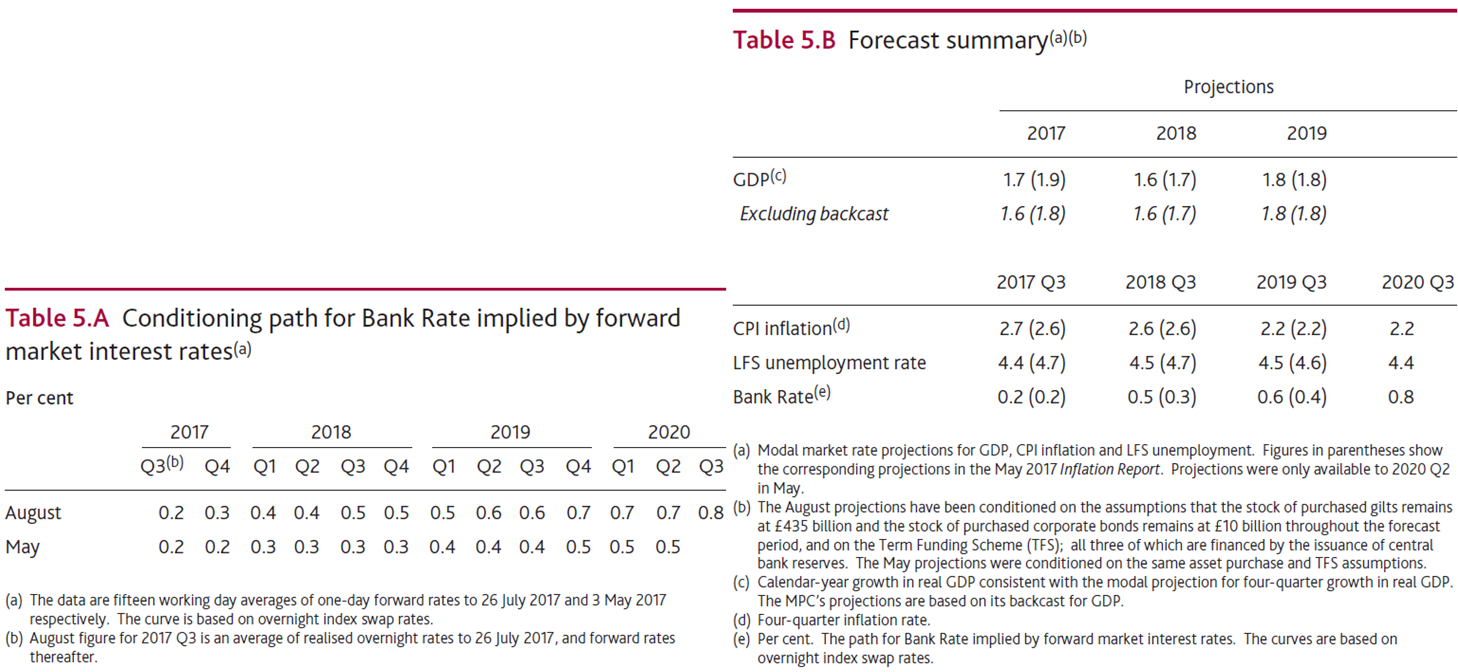
Even though BoE officials note ‘financial market prices now imply a rise in Bank Rate in 2018 Q3, compared with 2019 Q4 at the time of the May Report,’ it seems as though the majority remains in no rush to implement higher borrowing-costs as ‘consumption growth remains subdued as households continue to adjust to a period of weak real income growth.’ With Sir David Ramsdenjoining the Monetary Policy Committee (MPC) at the next meeting on September 14, Ian McCafferty and Michael Saunders may go up against a growing majority, and the British Pound may exhibit a bearish behavior over the days ahead as Governor Mark Carney an Co. tame expectations for a 2017 rate-hike.
GBP/USD Daily Chart
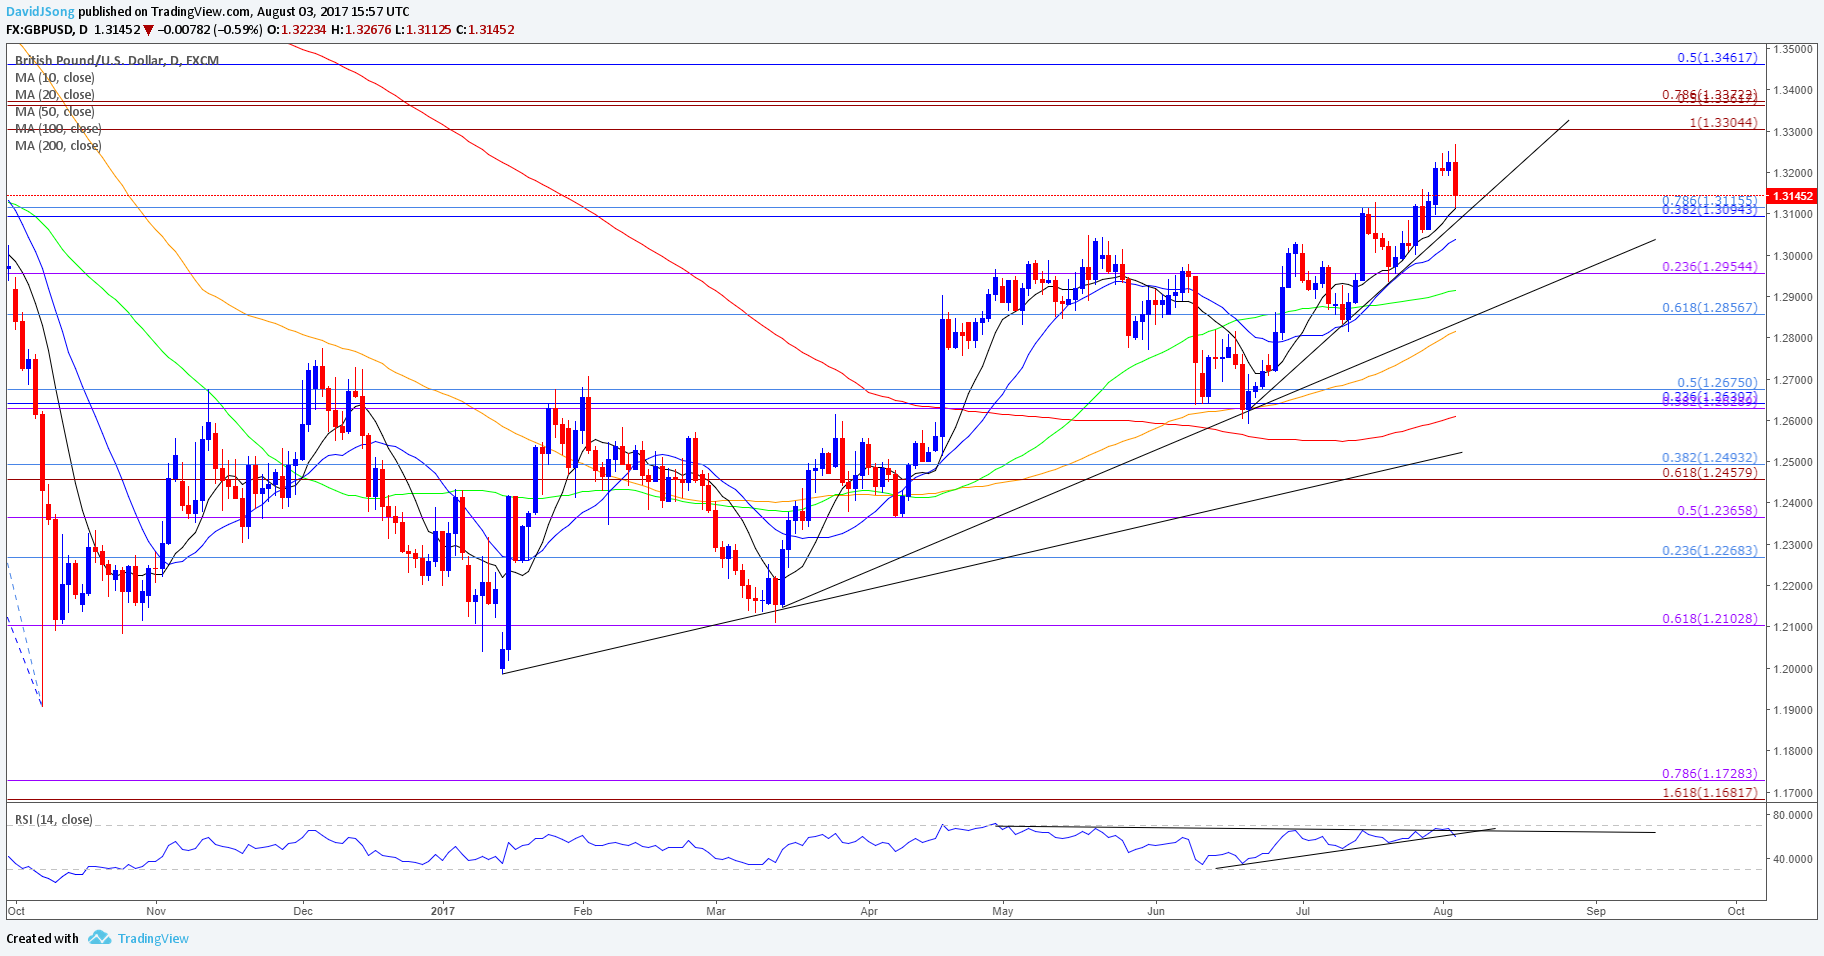
Chart - Created Using Trading View
- Keeping a close eye on the monthly opening range as GBP/USD pulls back from a fresh 2017-high (1.3268) and fails to preserve the bullish sequence carried over from the previous week; near-term outlook remains capped by the Fibonacci overlap around 1.3300 (100% expansion) to 1.3370 (78.6% expansion).
- At the same time, the Relative Strength Index (RSI) appears to be turning ahead of overbought territory, with the oscillator flashing a bearish trigger as it threatens the upward trend from June.
- In turn, a break/close below the 1.3090 (38.2% retracement) to 1.3120 (78.6% retracement) region may spur a move towards 1.2950 (23.6% retracement), with the next downside hurdle sitting in around 1.2860 (61.8% retracement), which comes in just above the July-low (1.2812).
Retail FX Sentiment
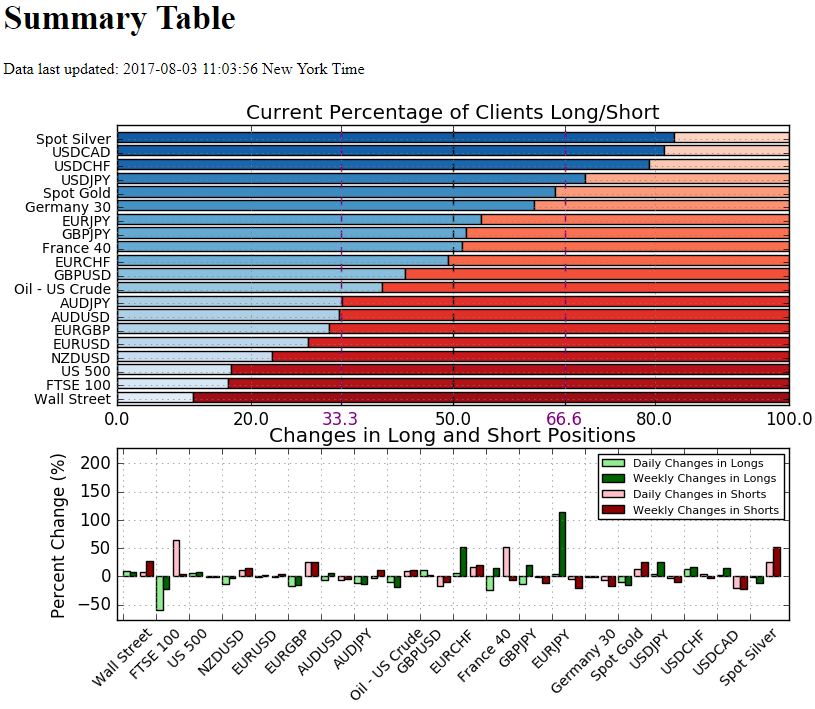
Track Retail Sentiment with the New Gauge Developed by DailyFX Based on Trader Positioning
- Retail trader data shows 69.6% of traders are net-long USD/JPY with the ratio of traders long to short at 2.29 to 1. In fact, traders have remained net-long since July 18 when USD/JPY traded near 112.602; price has moved 2.2% lower since then. The number of traders net-long is 4.1% higher than yesterday and 25.9% higher from last week, while the number of traders net-short is 2.7% lower than yesterday and 9.9% lower from last week.
- Retail trader data shows 42.8% of traders are net-long GBP/USD with the ratio of traders short to long at 1.34 to 1. In fact, traders have remained net-short since June 23 when GBP/USD traded near 1.27744; price has moved 2.9% higher since then. The number of traders net-long is 12.2% higher than yesterday and 2.7% higher from last week, while the number of traders net-short is 17.2% lower than yesterday and 10.2% lower from last week.
Click Here for the DailyFX Calendar
--- Written by David Song, Currency Analyst
To contact David, e-mail dsong@dailyfx.com. Follow me on Twitter at @DavidJSong.
To be added to David's e-mail distribution list, please follow this link.


