


Talking Points:
- USD/CAD Bullish Outlook Unravels as BoC’s Poloz Declares Mission Accomplished.
- NZD/USD Fails to Test 2017-High Amid Cautious RBNZ Statement of Intent.
| Currency | Last | High | Low | Daily Change (pip) | Daily Range (pip) |
|---|---|---|---|---|---|
| USD/CAD | 1.3066 | 1.3199 | 1.3051 | 133 | 148 |
USD/CAD is quickly approaching the 2017-low (1.2964) as the Bank of Canada (BoC) adopts a more upbeat tone and shows a greater willingness to move away from its easing-cycle.
The BoC appears to be on course to alter the monetary policy outlook as Governor Stephen Poloz argues the rate cuts from 2015 ‘have done their job,’ and the central bank may continue to change its tune over the coming months as ‘the Canadian economy’s adjustment to lower oil prices is largely complete and recent economic data have been encouraging.’ As a result, a major shift in market behavior could be underway as the long-term bullish outlook for USD/CAD unravels, with the pair at risk for a further decline as it initiates a bearish sequence going into the end of the month.
In contrast, fresh remarks from Federal Open Market Committee (FOMC) Chair Janet Yellen have failed to generate a meaningful reaction, with Fed Fund Futures still pricing a 50/50 chance for a move in December. In turn, the U.S. dollar stands at risk of facing a more bearish scenario in the second-half of 2017 should the central bank merely attempt to buy more time at the next interest rate decision on July 26.
USD/CAD Daily

Chart - Created Using Trading View
- USD/CAD stands at risk of extending the recent series of lower highs & lows as it fails to preserve the range from earlier this month; will keep a close eye on the Relative Strength Index (RSI) as it flirts with oversold territory, with a break below 30 raising the risk for a further decline in the exchange rate as the bearish momentum gathers pace.
- A close below the 1.3130 (50% retracement) hurdle opening up the next downside region of interest around 1.3030 (50% expansion) following by the key support zone around 1.2970 (61.9% retracement) to 1.2990 (23.6% retracement), which sits just above the 2017-low (1.2964).
Have a question about the currency markets? Join a Trading Q&A webinar and ask it live!
| Currency | Last | High | Low | Daily Change (pip) | Daily Range (pip) |
|---|---|---|---|---|---|
| NZD/USD | 0.7298 | 0.7300 | 0.7254 | 27 | 46 |
NZD/USD may fail to test the 2017-high (0.7376) as the Reserve Bank of New Zealand (RBNZ) endorses a cautious outlook and remains in no rush to lift the official cash rate off of the record-low.
It sees as though the RBNZ will remain on the sidelines in the third-quarter of 2017 as officials warn ‘a key domestic risk continues to be the performance of the housing market,’ and Governor Graeme Wheeler may continue to endorse a wait-and-see approach ahead of his departure in September as ‘major challenges still remain, with ongoing surplus capacity in the global economy and extensive geopolitical uncertainty.’ With that said, the near-term resilience in NZD/USD may taper off as the pair broadly tracks the downward trend carried over from 2016.
NZD/USD Daily
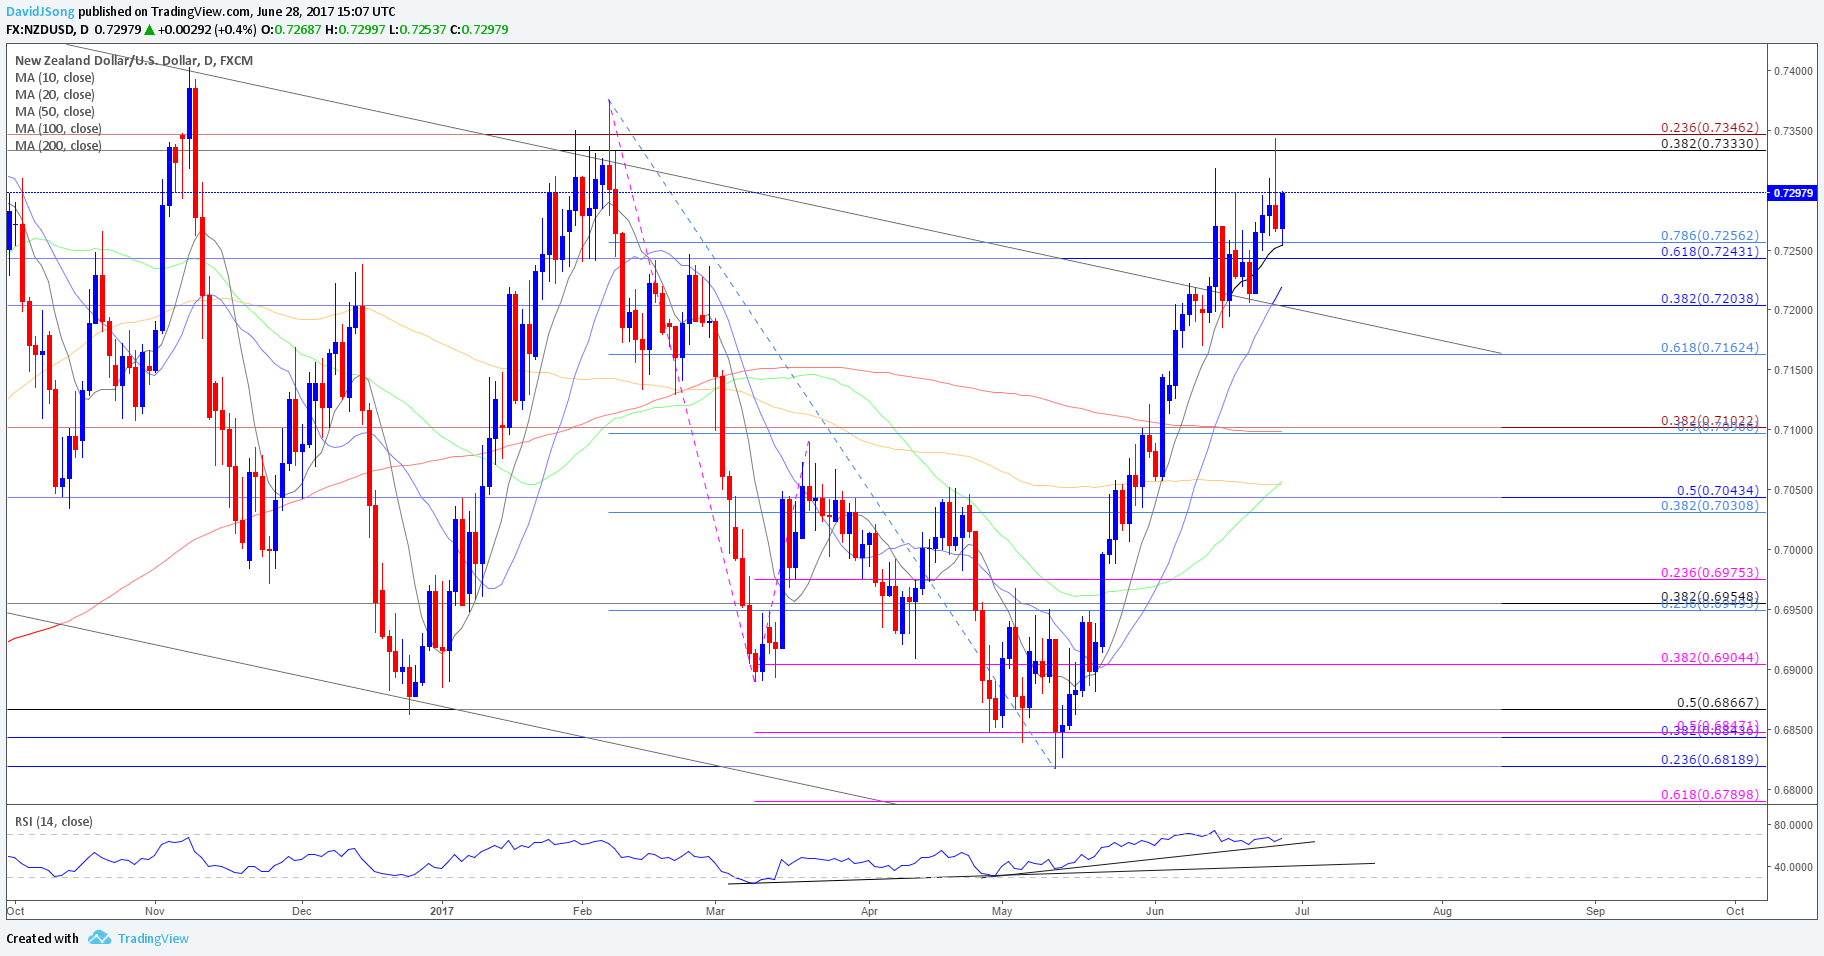
Chart - Created Using Trading View
- Failure preserve the recent string of higher highs & lows may keep NZD/USD capped by the Fibonacci overlap key resistance zone around 0.7330 (38.2% retracement) to 0.7350 (23.6% expansion), with the Relative Strength Index (RSI) starting to diverge with price as it fails to push back into overbought territory; may see the oscillator flash a bearish signal should the momentum indicator threaten the bullish formations from earlier this year.
- A break/close below the Fibonacci overlap around 0.7240 (61.8% retracement) to 0.7260 (78.6% retracement) may spur a move back towards the 0.7200 (38.2% retracement) handle, with the next downside hurdle coming in around 0.7160 (61.8% retracement) followed by the 0.7100 (38.2% expansion) handle, which largely lines up with the 200-Day SMA (0.7099).
Make Sure to Check Out the DailyFX Guides for Additional Trading Ideas.

Check Out the New Gauge Developed by DailyFX Based on Trader Positioning
- Retail trader data shows 67.8% of traders are net-long USD/CAD with the ratio of traders long to short at 2.1 to 1. In fact, traders have remained net-long since June 07 when USD/CAD traded near 1.34768; price has moved 3.0% lower since then. The number of traders net-long is 11.2% lower than yesterday and 6.9% lower from last week, while the number of traders net-short is 27.6% lower than yesterday and 23.5% lower from last week.
- Retail trader data shows 13.1% of traders are net-long NZD/USD with the ratio of traders short to long at 6.61 to 1. In fact, traders have remained net-short since May 24 when NZD/USD traded near 0.69227; price has moved 5.4% higher since then. The number of traders net-long is 14.6% lower than yesterday and 9.5% lower from last week, while the number of traders net-short is 8.3% higher than yesterday and 13.6% higher from last week.
Click Here for the DailyFX Calendar
--- Written by David Song, Currency Analyst
To contact David, e-mail dsong@dailyfx.com. Follow me on Twitter at @DavidJSong.
To be added to David's e-mail distribution list, please follow this link.


