


Talking Points:
- USD/CAD Rebound Unravels Following Upbeat Canada Retail Sales Report- CPI on Tap.
- GBP/USD Continues to Carve Lower-Highs Ahead of More BoE Rhetoric.
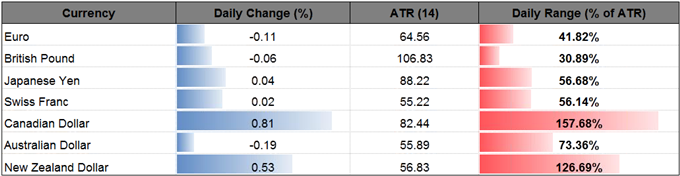
| Currency | Last | High | Low | Daily Change (pip) | Daily Range (pip) |
|---|---|---|---|---|---|
| USD/CAD | 1.3227 | 1.3338 | 1.3208 | 107 | 130 |
USD/CAD struggles to preserve the advance from earlier this week as Canada’s Retail Sales report exceeds market expectations, with household spending increasing 0.8% in April amid forecasts for a 0.3% print.
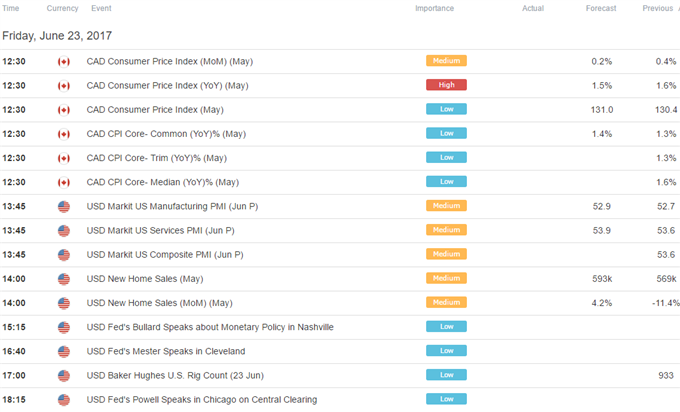
The near-term rebound in USD/CAD may continue to unravel as it fails to retain the bullish sequence from earlier this week, and the positive developments coming out of the real economy may encourage the Bank of Canada (BoC) to adopt a hawkish tone over the coming months as Governor Stephen Poloz and Co. note ‘the Canadian economy’s adjustment to lower oil prices is largely complete.’ Even though the region’s Consumer Price Index (CPI) is expected to slow to an annualized 1.5% from 1.6% in April, a pickup in the core rate of inflation may ultimately generate a bullish reaction in the Canadian dollar as it puts pressure on the BoC to lift the benchmark interest rate off of the record-low.
USD/CAD Daily
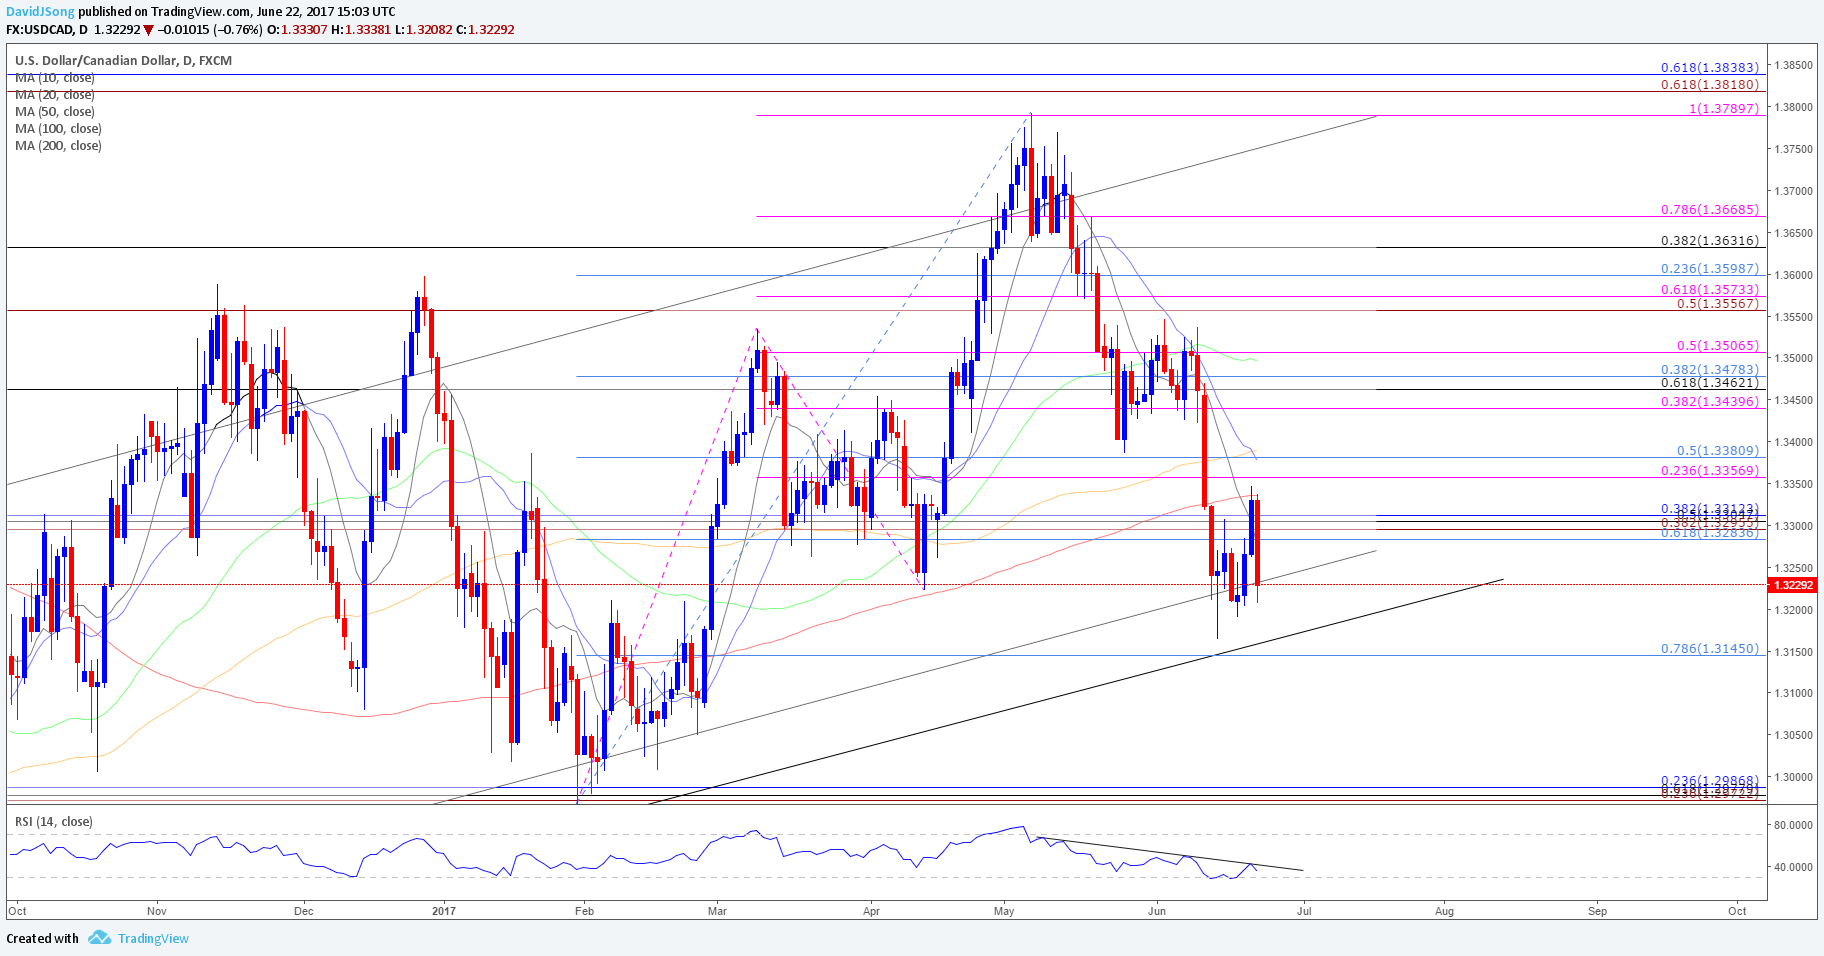
Chart - Created Using Trading View
- USD/CAD stands at risk of facing range-bound conditions over the days ahead as it fails to extend the recent series of higher highs & lows, with the pair largely capped by the Fibonacci overlap around 1.3360 (23.6% expansion) to 1.3380 (50% retracement), which sits just above the 200-Day SMA (1.3336).
- In turn, dollar-loonie may once again threaten the upward trend from 2016 especially as the Relative Strength Index (RSI) preserves the bearish formation carried over from the previous month.
- Nevertheless, failure to hold above the June-low (1.3165) may spur a test of the 1.3150 (78.6% retracement) hurdle, with a more convincing break of trendline support opening up the key support zone around 1.2970 (23.6% expansion) to 1.2990 (23.6% retracement), which largely lines up with the 2017-low (1.3076).
Have a question about the currency markets? Join a Trading Q&A webinar and ask it live!
| Currency | Last | High | Low | Daily Change (pip) | Daily Range (pip) |
|---|---|---|---|---|---|
| GBP/USD | 1.2664 | 1.2687 | 1.2654 | 7 | 33 |
GBP/USD stands at risk for further losses as it continues to carve a series of lower-highs, and the recent price action suggests market participants are unmoved by the mixed rhetoric coming out of the Bank of England (BoE) as the economic outlook for the region remains clouded with high uncertainty.
Kristen Forbes is likely to relay a hawkish message tomorrow as she warns the BoE has ‘been underestimating the inflationary pressures,’ but the fresh comments may generate a limited reaction as she departs the Monetary Policy Committee (MPC) at the end of the month. In turn, market participants may turn their attention to the European Central Bank’s (ECB) Forum on Central Banking on tap for next week as Governor Mark Carney is scheduled to speak at the event, and the fresh remarks may drag on the British Pound as the central bank head argues now is ‘not the time to begin’ normalizing monetary policy.
GBP/USD Daily
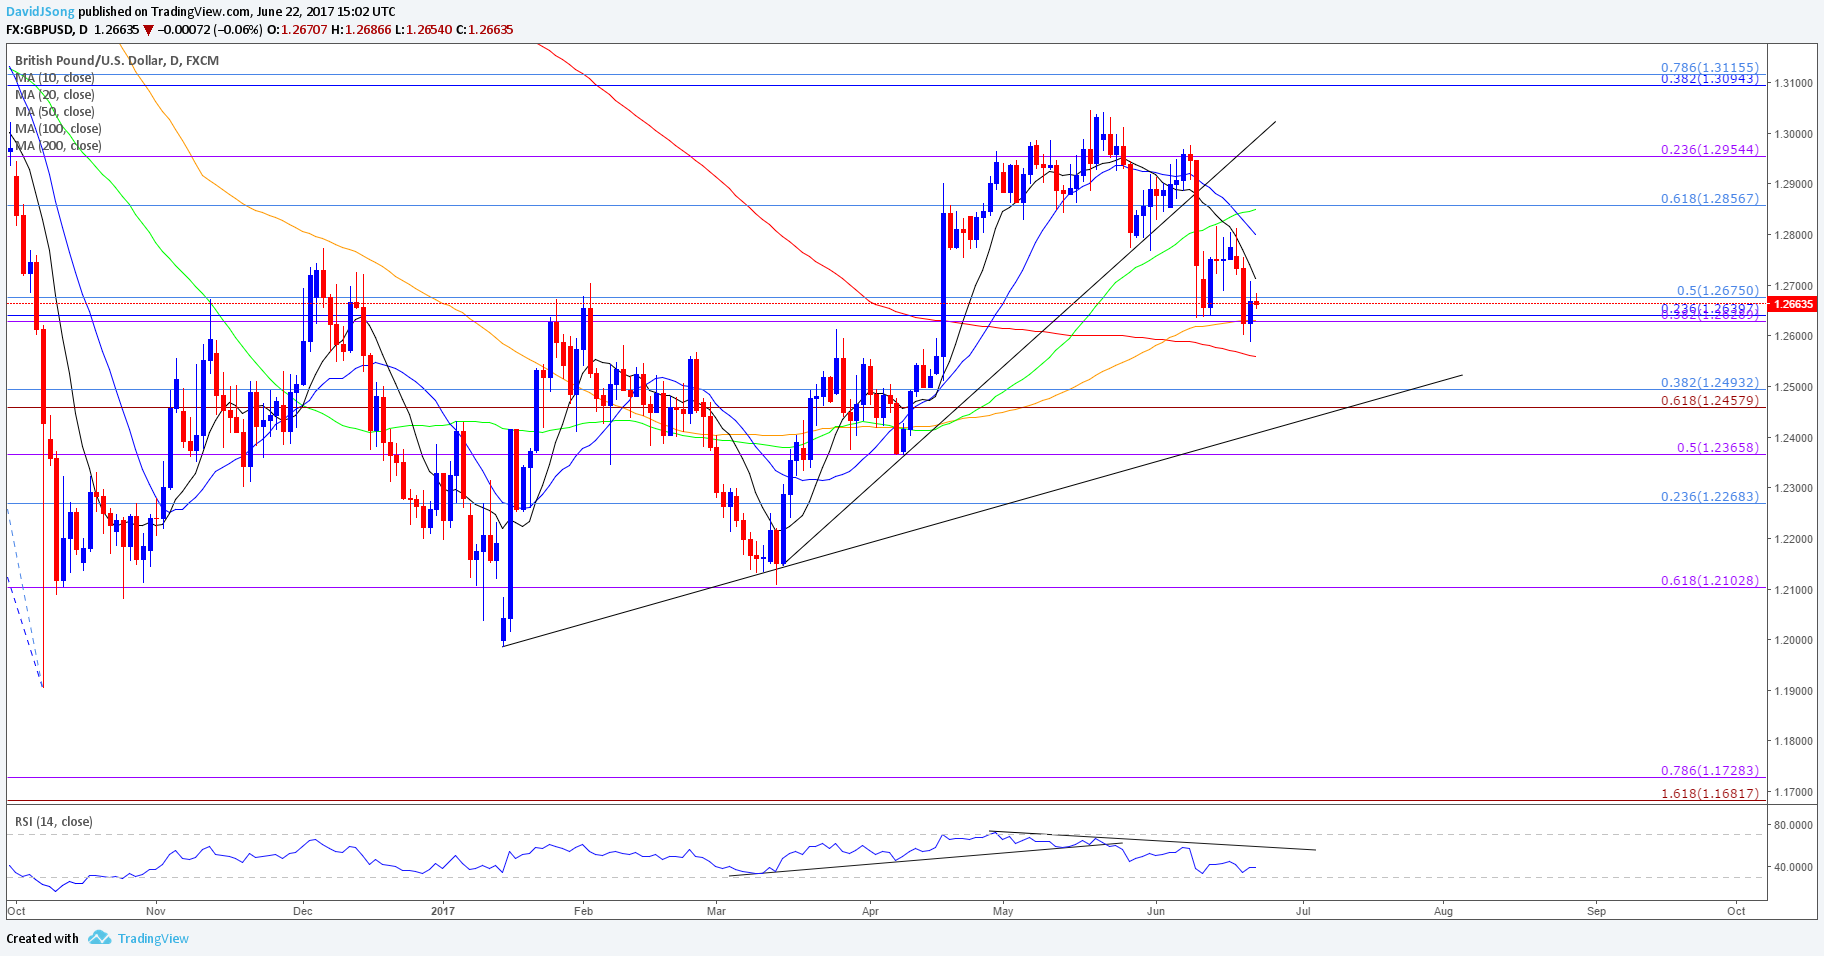
Chart - Created Using Trading View
- The near-term outlook for GBP/USD remains tilted to the downside as the pair fails to preserve the upward trend from March, and it seems as though it will only be a matter of time before the pair makes a more meaningful run at the 200-Day SMA (1.2559) as it extends the series of lower-highs from earlier this week.
- The Relative Strength Index (RSI) also highlights the risk for further losses as it retains the bearish formation carried over from the previous month, but will keep a close eye on the oscillator as it struggles to push into oversold territory.
- A break below the moving average may open up the Fibonacci overlap around around 1.2460 (61.8% expansion) to 1.2490 (38.2% retracement), with the next downside region of interest coming in around 1.2370 (50% expansion).
Make Sure to Check Out the DailyFX Guides for Additional Trading Ideas.
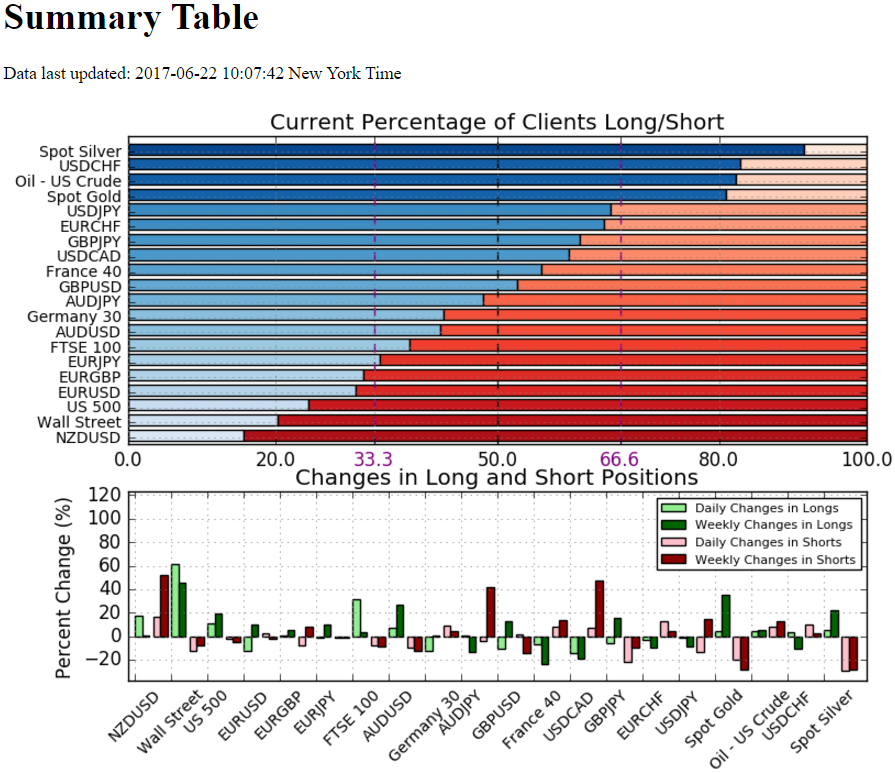
- Retail trader data shows 59.7% of traders are net-long USD/CAD with the ratio of traders long to short at 1.48 to 1. In fact, traders have remained net-long since June 07 when USD/CAD traded near 1.34474; price has moved 1.6% lower since then. The number of traders net-long is 14.1% lower than yesterday and 19.2% lower from last week, while the number of traders net-short is 7.1% higher than yesterday and 46.9% higher from last week.
- Retail trader data shows 52.6% of traders are net-long GBP/USD with the ratio of traders long to short at 1.11 to 1. The number of traders net-long is 11.1% lower than yesterday and 13.0% higher from last week, while the number of traders net-short is 1.8% higher than yesterday and 14.1% lower from last week.
For More Information on Retail Sentiment, Check Out the New Gauge Developed by DailyFX Based on Trader Positioning
Click Here for the DailyFX Calendar
--- Written by David Song, Currency Analyst
To contact David, e-mail dsong@dailyfx.com. Follow me on Twitter at @DavidJSong.
To be added to David's e-mail distribution list, please follow this link.


