


Talking Points:
- NZD/USD Flash First Overbought Signal in 2017; RBNZ Proposes Debt-to-Income Tool.
- USD/JPY Decline Stalls Ahead of April-Low; Bullish RSI Trigger on Tap?
| Currency | Last | High | Low | Daily Change (pip) | Daily Range (pip) |
|---|---|---|---|---|---|
| NZD/USD | 0.7217 | 0.7223 | 0.7188 | 22 | 35 |
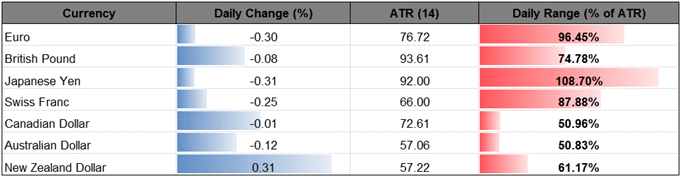
The New Zealand dollar outperforms its major counterparts, with NZD/USD climbing to a fresh monthly high of 0.7222, and the pair may continue to appreciate over the coming days as it makes a more meaningful attempt to break out of the downward trend carried over from 2016.
Even though the Reserve Bank of New Zealand (RBNZ) is widely expected to preserve the record-low cash rate at the June 22 interest rate decision, the central bank proposed a debt-to-income instrument, which ‘would reduce the risk of a severe housing downturn in certain circumstances, and attenuate the impact of any downturn on the wider economy,’ and Governor Graeme Wheeler and Co. may show a greater willingness to gradually move away from its easing cycle as ‘the growth outlook remains positive, supported by on-going accommodative monetary policy, strong population growth, and high levels of household spending and construction activity.’ With that said, the RBNZ may merely try to buy more time with Governor Wheeler scheduled to depart in September, and a less-dovish policy statement may heighten the appeal of the New Zealand dollar as market participants scale back bets for additional monetary support.
NZD/USD Daily
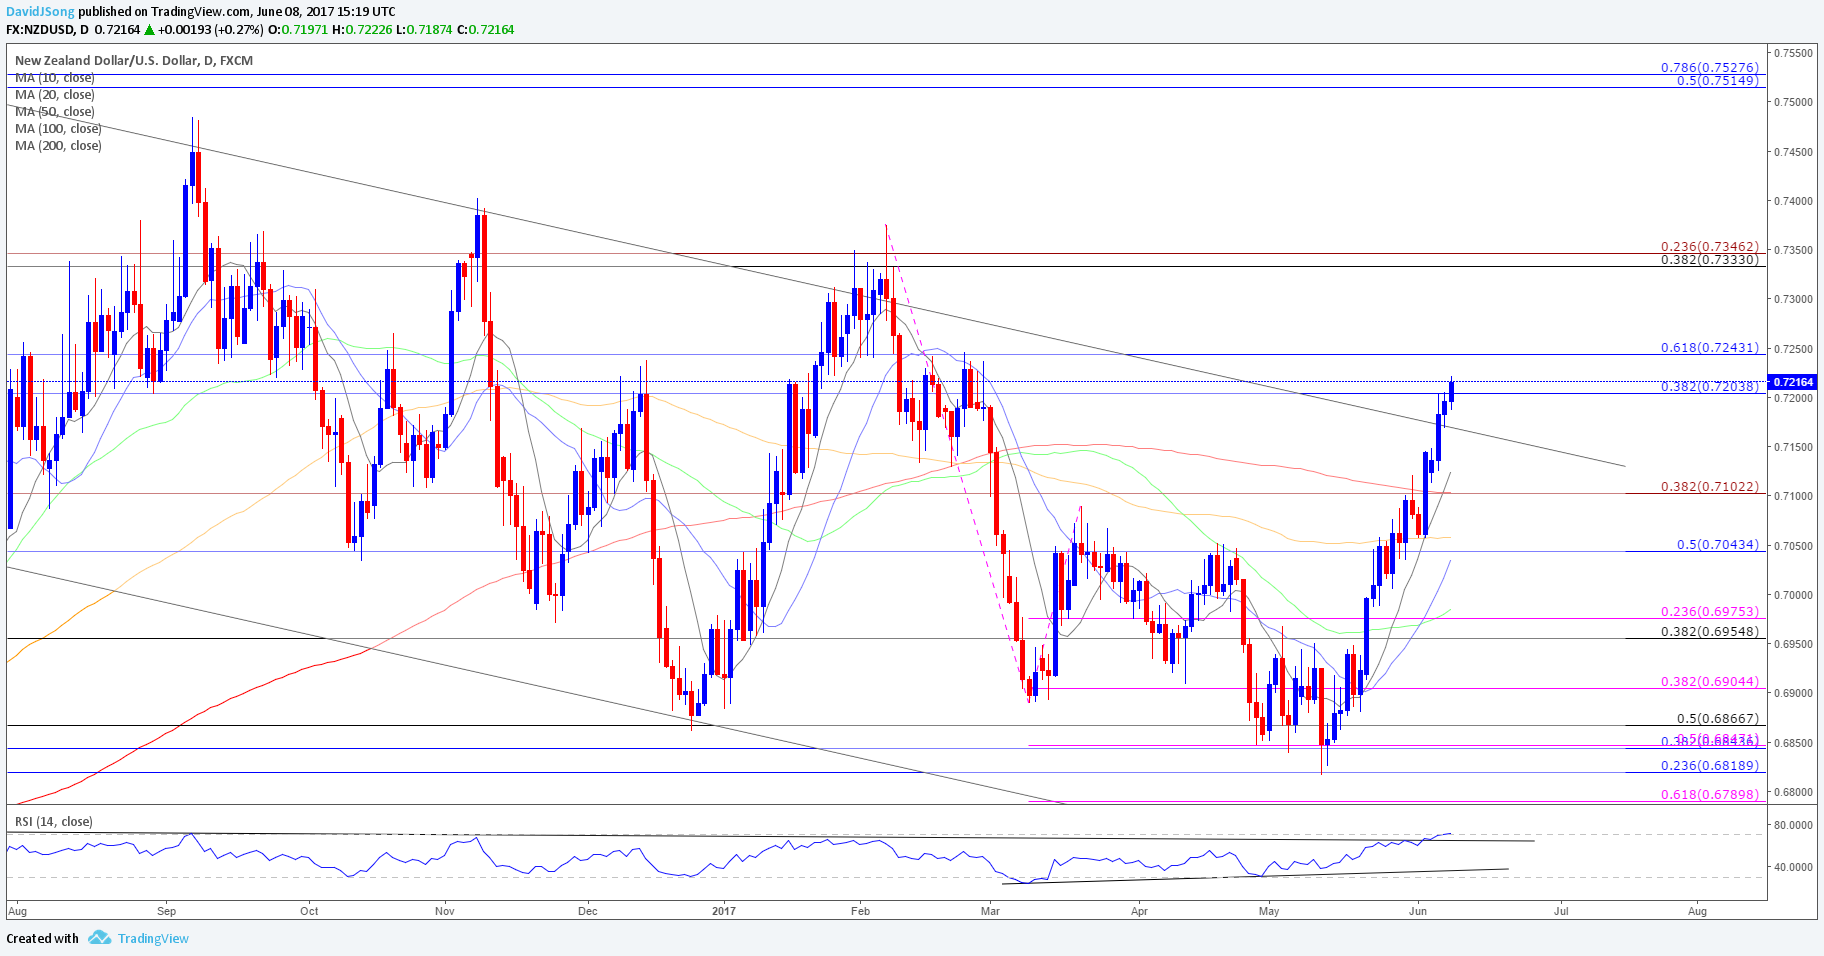
Chart - Created Using Trading View
- NZD/USD may continue to retrace the decline from earlier this year as the pair makes a more meaningful attempt to break out the downward trending channel carried over from 2016; the Relative Strength Index (RSI) appears to be highlighting a similar dynamic as the oscillator threatens the bearish formation from last June and pushes into overbought territory for the first time this year.
- With that said, a break/close above the Fibonacci overlap around 0.7200 (38.2% retracement) to 0.7240 (61.8% retracement) may open up the next topside hurdle around 0.7330 (38.2% retracement) to 0.7350 (23.6% expansion), which sits just below the 2017-high (0.7376).
Have a question about the currency markets? Join a Trading Q&A webinar and ask it live!
| Currency | Last | High | Low | Daily Change (pip) | Daily Range (pip) |
|---|---|---|---|---|---|
| USD/JPY | 110.16 | 110.38 | 109.38 | 34 | 100 |
USD/JPY pares the decline from earlier this week, with the pair at risk for a larger rebound as it appears to have made a failed attempt to test the April-low (108.13). The recent volatility in the dollar-yen exchange rate appears to be broadly tracking market sentiment as the global benchmark equity indices track higher ahead of the weekend, and a further pickup in risk appetite may prop up USD/JPY as market participants continue to utilize the Japanese Yen as a funding-currency.
USD/JPY Daily

Chart - Created Using Trading View
- USD/JPY stands at risk for a larger rebound as the recent series of lower highs & lows unravel, and the Relative Strength Index (RSI) may flash a bullish trigger as it turns around ahead of oversold territory and comes up against trendline resistance.
- With that said, USD/JPY may make another attempt to break out of the downward trending channel carried over from late-2016, with the first topside hurdle coming in around 111.10 (61.8% expansion) to 111.60 (38.2% retracement) followed by 112.40 (61.8% retracement) to 112.80 (38.2% expansion).
Make Sure to Check Out the DailyFX Guides for Additional Trading Ideas.
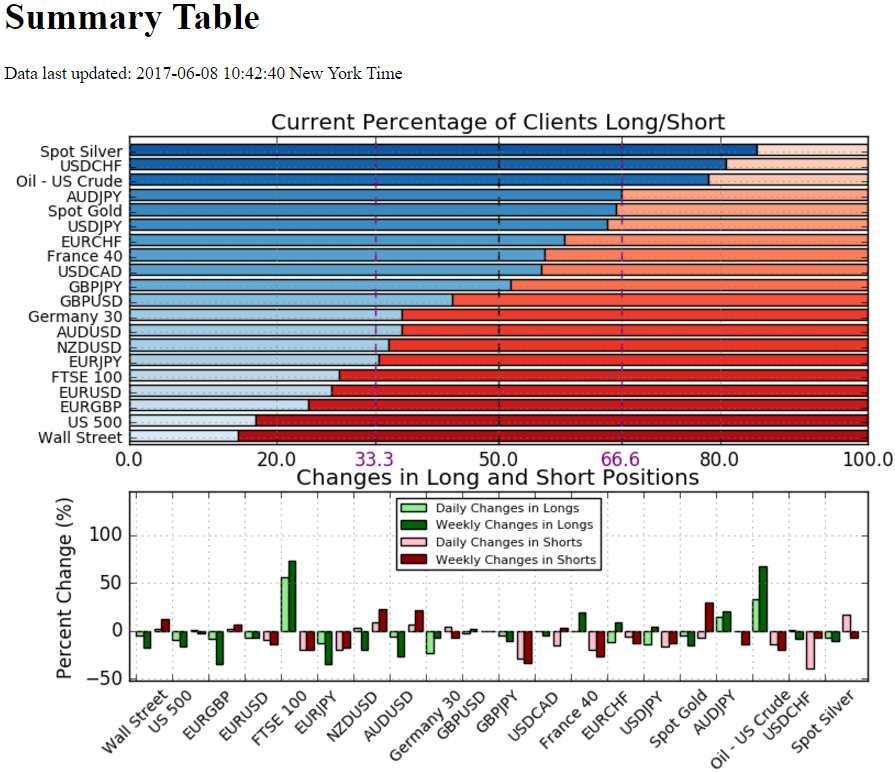
- Retail trader data shows 35.1% of traders are net-long NZD/USD with the ratio of traders short to long at 1.85 to 1. In fact, traders have remained net-short since May 24 when NZD/USD traded near 0.7016; price has moved 2.9% higher since then. The number of traders net-long is 2.6% higher than yesterday and 20.5% lower from last week, while the number of traders net-short is 9.3% higher than yesterday and 22.4% higher from last week.
- Retail trader data shows 27.4% of traders are net-long EUR/USD with the ratio of traders short to long at 2.64 to 1. In fact, traders have remained net-short since April 18 when EUR/USD traded near 1.06661; price has moved 5.2% higher since then. The number of traders net-long is 7.5% lower than yesterday and 7.4% lower from last week, while the number of traders net-short is 9.4% lower than yesterday and 14.2% lower from last week.
For More Information on Retail Sentiment, Check Out the New Gauge Developed by DailyFX Based on Trader Positioning
Click Here for the DailyFX Calendar
For LIVE Updates, Join DailyFX Currency Analyst David Song for LIVE Analysis!
--- Written by David Song, Currency Analyst
To contact David, e-mail dsong@dailyfx.com. Follow me on Twitter at @DavidJSong.
To be added to David's e-mail distribution list, please follow this link.


