Talking Points:
- USD/JPY Extends Bearish Series; Downside Targets in Focus as Risk Appetite Dissipates.
- AUD/USD Struggles Ahead of Australia Employment as S&P Warns of Credit-Rating Downgrade.

| Currency | Last | High | Low | Daily Change (pip) | Daily Range (pip) |
|---|---|---|---|---|---|
| USD/JPY | 111.18 | 113.13 | 111.16 | 194 | 197 |
USD/JPY extends the series of lower highs & lows from the previous week, with the pair at risk for further losses as market participants scale back their appetite for risk. The recent weakness in the global benchmark equity indices may continue to prop up the Japanese Yen as it drags on carry-trade interest, and risk sentiment may influence the dollar-yen exchange rate over the near-term as the economic docket remains fairly light for the remainder of the month.
Even though the Federal Open Market Committee (FOMC) is still expected to deliver a 25bp rate-hike in June, market participants appear to be taming the longer-term outlook for monetary policy, with Fed Fund Futures now highlighting a less than 50% probability for a move in December. As a result, the greenback stands at risk of facing headwinds in the second-half of 2017 as interest-rate expectations deteriorate.
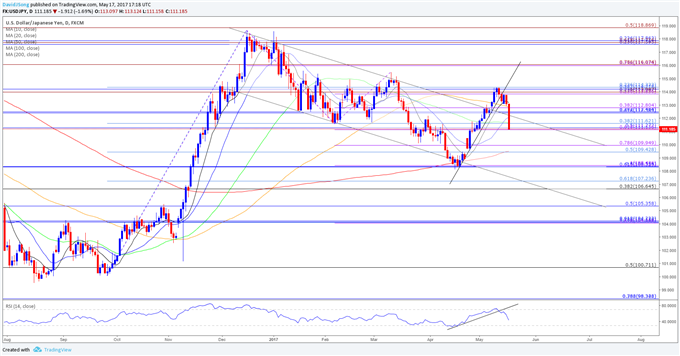
USD/JPY Daily

Chart - Created Using Trading View
- The near-term outlook for USD/JPY has shift to the downside following the failed attempt to break/close above the 114.30 (23.6% retracement) hurdle, and the pair may continue to give back the rebound from the April low (108.13) as it carves a bearish series, with price & the Relative Strength Index (RSI) struggling to preserve the bullish formation carried over from the previous month.
- Lack of momentum to hold above the Fibonacci overlap around 112.40 (61.8% retracement) to 112.80 (38.2% expansion) raises the risk for a larger correction especially as former-channel resistance fails to provide support, with the next area of interest coming in around 111.10 (61.8% expansion) to 111.60 (38.2% retracement) followed by 109.40 (50% retracement) to 110.00 (78.6% expansion).
Have a question about the currency markets? Join a Trading Q&A webinar and ask it live!
| Currency | Last | High | Low | Daily Change (pip) | Daily Range (pip) |
|---|---|---|---|---|---|
| AUD/USD | 0.7429 | 0.7444 | 0.7389 | 3 | 55 |
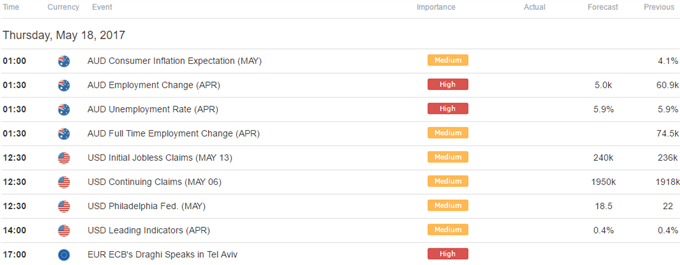
AUD/USD struggles to preserve the advance from earlier this week as Standard and Poor’s warned the credit-rating outlook for Australia remains ‘negative,’ with the group noting that ‘we could lower our ratings within the next two years if we were to lose confidence that the general government fiscal deficit will revert into surplus by the early 2020s.’ The cautious tone struck by S&P accompanied by record-low wage growth may encourage the Reserve Bank of Australia (RBA) to keep the cash rate at the record-low throughout 2017 amid the ongoing slack in the real economy.
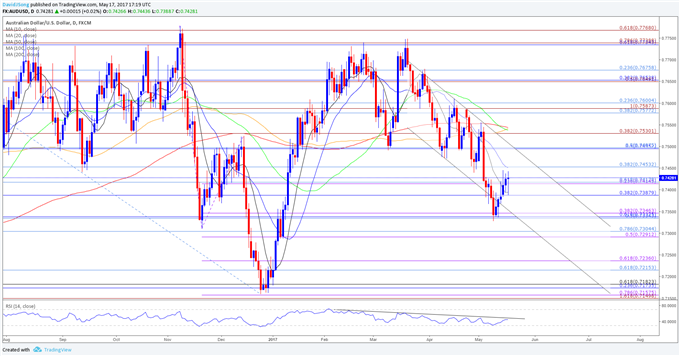
AUD/USD Daily

Chart - Created Using Trading View
- With that said, AUD/USD stands at risk for a further decline amid the lack of momentum to push above the 0.7450 (38.2% retracement) hurdle, and the downside targets remain in focus especially as price & the Relative Strength Index (RSI) preserve the bearish formations from earlier this year.
- A close below 0.7390 (38.2% retracement) may spur another test of the Fibonacci overlap around 0.7330 (50% retracement) to 0.7360 (38.2% expansion), with the next downside region of interest coming in around 0.7290 (50% expansion) to 0.7300 (78.6% retracement).
Make Sure to Check Out the DailyFX Guides for Additional Trading Ideas.

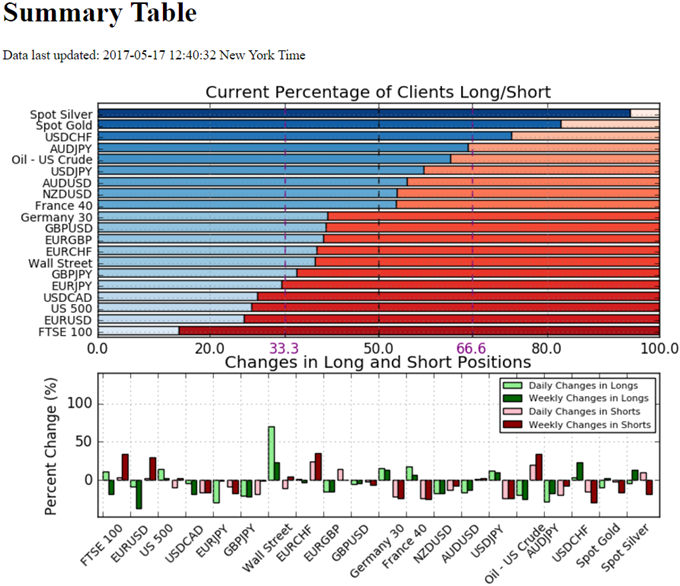
- Retail trader data shows 58.0% of traders are net-long USD/JPY with the ratio of traders long to short at 1.38 to 1. The percentage of traders net-long is now its highest since April 26 when USD/JPY traded near 111.197. The number of traders net-long is 12.4% higher than yesterday and 10.0% higher from last week, while the number of traders net-short is 23.5% lower than yesterday and 24.5% lower from last week.
- Retail trader data shows 55.0% of traders are net-long AUD/USD with the ratio of traders long to short at 1.22 to 1. In fact, traders have remained net-long since May 03 when AUD/USD traded near 0.75395; price has moved 1.5% lower since then. The number of traders net-long is 16.5% lower than yesterday and 13.0% lower from last week, while the number of traders net-short is 1.5% higher than yesterday and 1.9% higher from last week.
For More Information on Retail Sentiment, Check Out the New Gauge Developed by DailyFX Based on Trader Positioning

Click Here for the DailyFX Calendar
For LIVE Updates, Join DailyFX Currency Analyst David Song for LIVE Analysis!
--- Written by David Song, Currency Analyst
To contact David, e-mail dsong@dailyfx.com. Follow me on Twitter at @DavidJSong.
To be added to David's e-mail distribution list, please follow this link.


