


Talking Points:
- USD/JPY Negates Inverse H&S; Nikkei Continues to Lag Behind.
- AUD/USD Outlook Clouded by RSI Divergence Ahead of Australia GDP Report.

| Currency | Last | High | Low | Daily Change (pip) | Daily Range (pip) |
|---|---|---|---|---|---|
| USD/JPY | 112.17 | 112.96 | 112.04 | 44 | 92 |
USD/JPY Daily
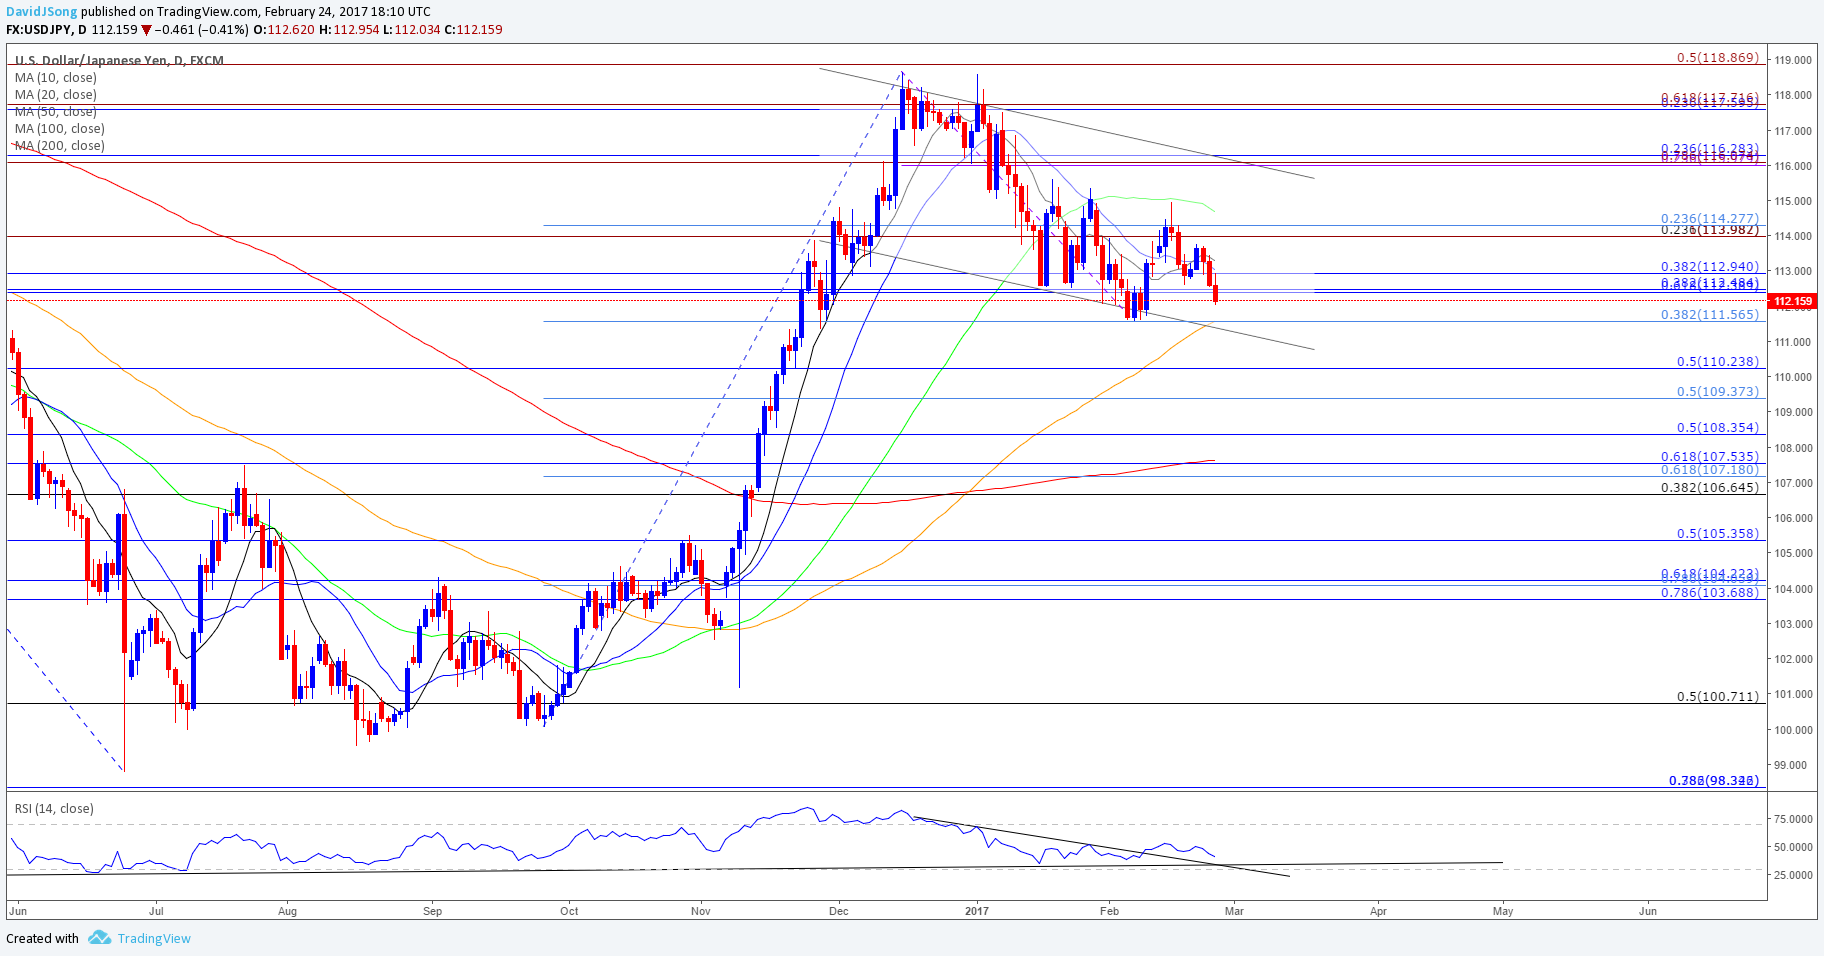
Chart - Created Using Trading View
- USD/JPY may continue to pare the rebound from earlier this month as it extends the series of lower highs & lows from earlier this week, with a close below 112.40 (61.8% retracement) to 112.50 (38.2% retracement) largely negating the risk for an inverse head-and-shoulders formation; longer-term outlook for the dollar-yen remains constructive as it continues to operate within the bull-flag carried over from late-2016, with Fed Fund Futures still highlighting a greater than 60% probability for a June rate-hike.
- With the Federal Open Market Committee (FOMC) largely anticipated to retain the current policy at the next interest rate decision on March 15, risk trends may continue to influence the dollar-yen exchange rate over the near-term as the Nikkei 225 appears to be stuck in a similar holding pattern; keep in mind the benchmark index for Japanese stocks have lagged behind its major counterparts, with the DAX as well as the S&P500 pressing fresh 2017-highs going into the end of the month.
- Failure to hold above the Fibonacci overlap around 112.40 (61.8% retracement) to 112.50 (38.2% retracement) may spur a move back towards 111.60 (38.2% retracement), but a break/close below the near-term support zone opens up the next downside target around 110.20 (50% retracement).
| Currency | Last | High | Low | Daily Change (pip) | Daily Range (pip) |
|---|---|---|---|---|---|
| AUD/USD | 0.7681 | 0.7720 | 0.7665 | 34 | 55 |
AUD/USD Daily
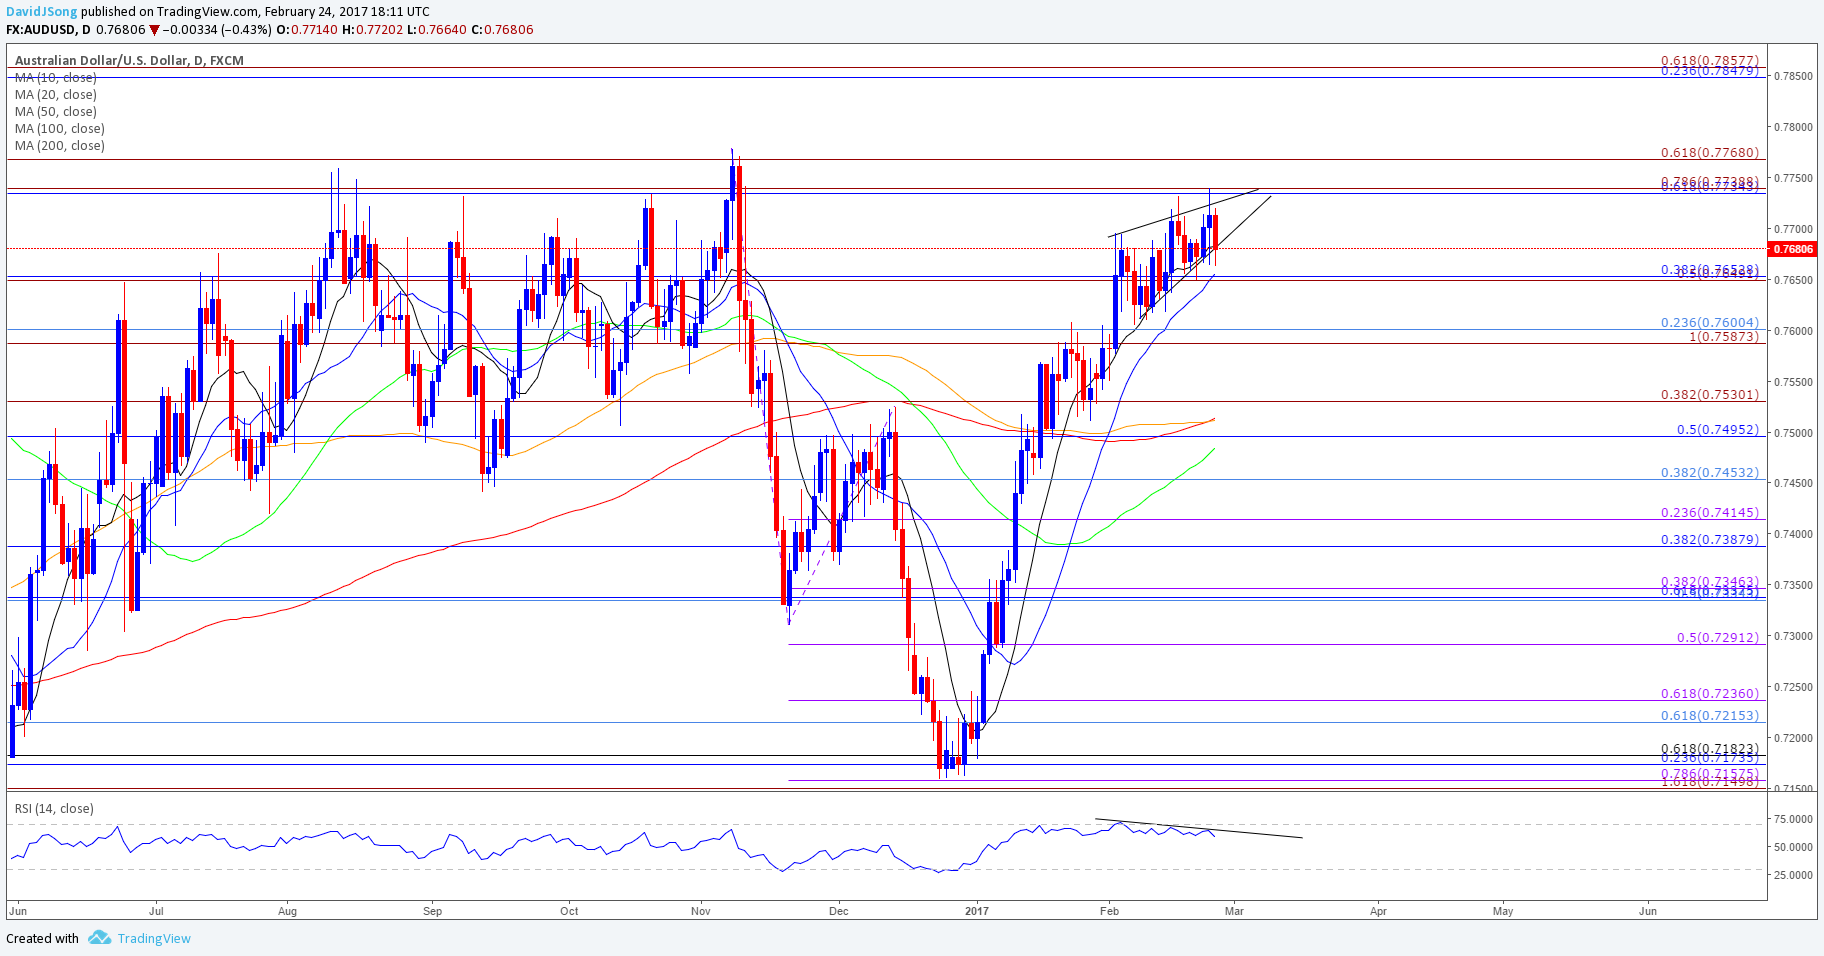
Chart - Created Using Trading View
- Fresh monthly highs in AUD/USD may heighten the appeal of the higher-yielding currency as the exchange rate appears to be coiling within a wedge/triangle formation, with the pair at risk for a squeeze higher as price approaches the apex of the continuation pattern; in turn aussie-dollar may make a more meaningful run at the 2016 high (0.7778) as long as the pair holds above the 0.7650 (38.2% retracement) region.
- However, the near-term outlook remains clouded with mixed signals as the Relative Strength Index (RSI) continues to deviate with price and struggles to push into overbought territory; the bearish formation in the oscillator suggests the 2017 rally is getting exhausted ahead of the key resistance zone around 0.7730 (61.8% retracement) to 0.7770 (61.8% expansion), with the pair at risk highlighting similar dynamics seen back in November.
- In turn, Australia’s 4Q Gross Domestic Product (GDP) report may sway the near-term outlook for AUD/USD as the economy is expected to grow 0.7% following the 0.5% contraction during the last three-months of 2016; a marked rebound in the growth rate may encourage the Reserve Bank of Australia (RBA) change its tune as ‘headline inflation is expected to be back above 2 percent later this year, boosted by higher prices for petrol and tobacco,’ and Governor Philip Lowe may show a greater willingness to gradually remove the accommodative policy stance as ‘there are reasonable prospects for inflation to rise towards the middle of the target over time.’
- With that said, topside targets remain on the radar ahead of March, with a break/close above 0.7730 (61.8% retracement) to 0.7770 (61.8% expansion) opening up the next topside area of interest around 0.7850 (23.6% retracement) to 0.7860 (61.8% expansion).
For More Updates, Join DailyFX Currency Analyst David Song for LIVE Analysis!
Click HERE for the Entire DailyFX Webinar schedule.

Click Here for the DailyFX Calendar
If you’re looking for trading ideas, check out our Trading Guides.
Read More:
DAX: New Highs Around the Bend
USD/CAD Technical Analysis: Wedging Between Hard Support And 200-DMA
Euro Opens The Week on The Backfoot as Uncertainty Grows
EUR/NZD Targeting Resistance- Monthly Range Break to Validate Outlook
--- Written by David Song, Currency Analyst
To contact David, e-mail dsong@dailyfx.com. Follow me on Twitter at @DavidJSong.
To be added to David's e-mail distribution list, please follow this link.


