


Talking Points:
- NZD/USD Rebound Stalls Ahead of December High (0.7239); NZ 4Q CPI on Horizon.
- USD/JPY Eyes Monthly Opening Range as 112.50 Offers Near-Term Support.

| Currency | Last | High | Low | Daily Change (pip) | Daily Range (pip) |
|---|---|---|---|---|---|
| NZD/USD | 0.7165 | 0.72 | 0.7118 | 42 | 82 |
NZD/USD Daily
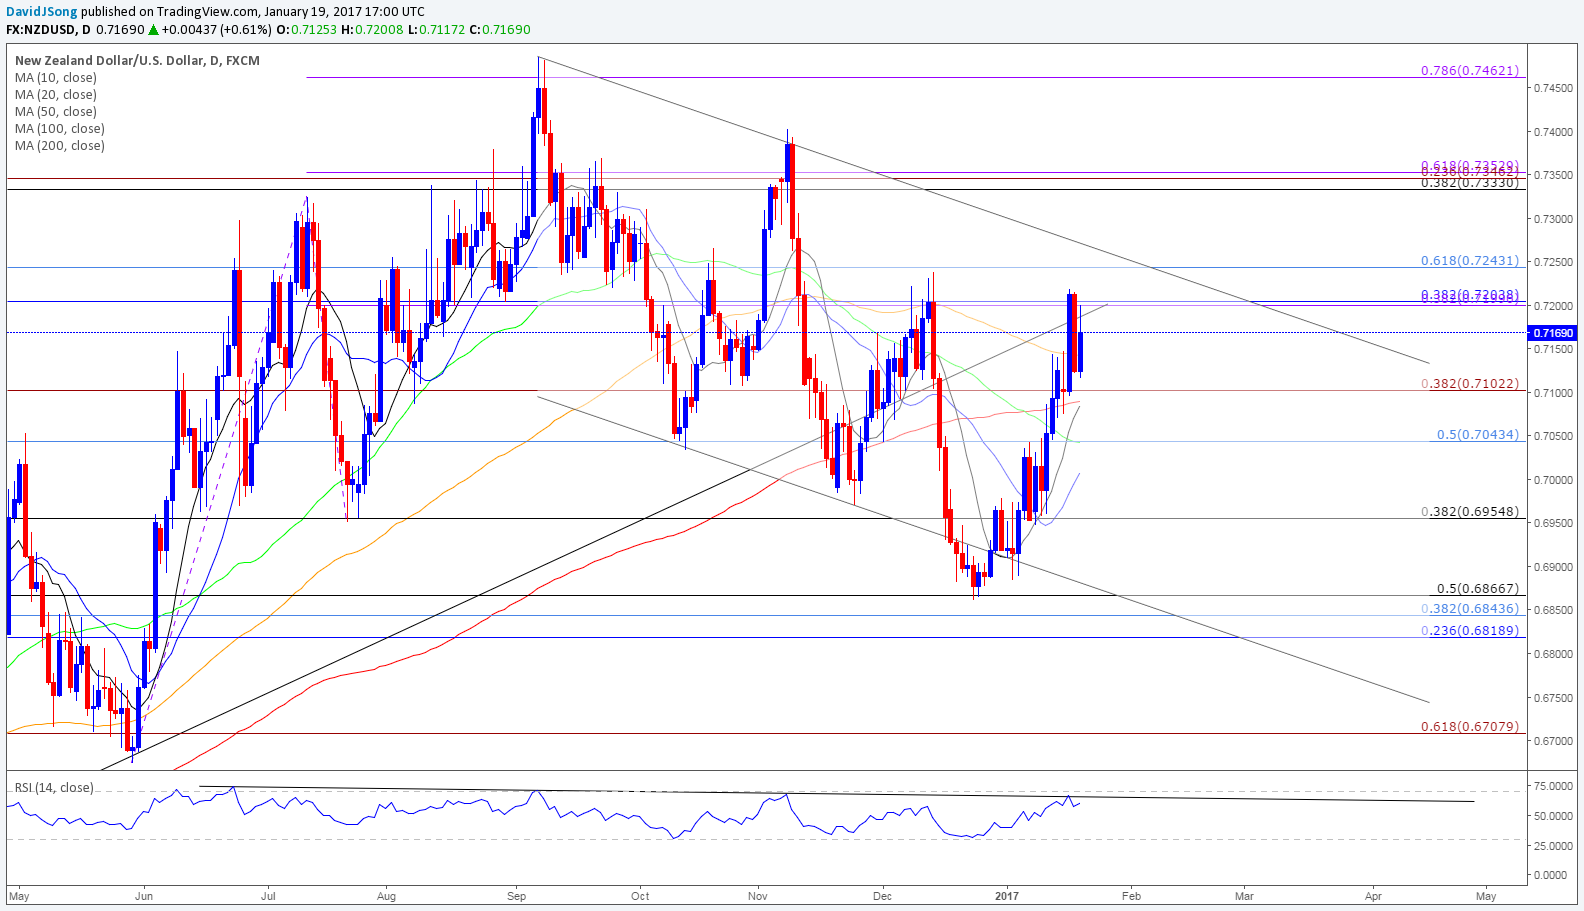
Chart - Created Using Trading View
- The near-term recovery in NZD/USD appears to be stalling ahead of the December high (0.7239) as the pair starts to carve a series of lower highs & lows, while the Relative Strength Index (RSI) seems to be responding to the bearish formation carried over from the previous year; broader outlook for kiwi-dollar remains tilted to the downside as the pair continues to operate within the descending channel from September.
- Nevertheless, New Zealand’s 4Q Consumer Price Index (CPI) on tap for the week ahead may heighten the appeal of the higher-yielding currency as the headline reading is projected to climb an annualized 1.3%, which would mark the fastest pace of growth since 2Q 2014; heightening price pressures may push the Reserve Bank of New Zealand (RBNZ) to change its tune for monetary policy, and Governor Graeme Wheeler may show a greater willingness to move away from the easing-cycle at the next interest rate decision on February 9 as ‘annual inflation is expected to rise from the December quarter, reflecting the policy stimulus to date, the strength of the domestic economy, and reduced drag from tradables inflation.’
- May see the near-term recovery in NZD/USD unravel as it fails to test the December high (0.7239), with a move/close below 0.7100 (38.2% expansion) opening up the downside targets; first region of interest comes around 0.7040 (50% retracement) followed by 0.6950 (38.2% retracement).
| Currency | Last | High | Low | Daily Change (pip) | Daily Range (pip) |
|---|---|---|---|---|---|
| USD/JPY | 115.37 | 115.53 | 114.4 | 72 | 113 |
USD/JPY Daily

Chart - Created Using Trading View
- USD/JPY may continue to retrace the decline from earlier this month following the failed run at the Fibonacci overlap around 112.40 (61.8% retracement) to 112.50 (38.2% retracement); may see a move back towards the monthly opening range as the dollar-yen reverses course and being to carve a series of lower highs & lows, but the broader outlook remains clouded as a double-top formation appears to be panning out, while the RSI fails to preserve the upward trend carried over from the summer months.
- With Fed Fund Futures still highlighting a greater than 60% probability for a June rate-hike, the deviating paths for monetary policy should keep the long-term outlook tilted to the topside as Chair Janet Yellen argues the central bank is close to achieving its dual mandate, but risk sentiment may continue to influence near-term price action as the dollar-yen exchange rate and the Nikkei 225 highlight similar dynamics; will continue to watch the newswires as the central bank head is scheduled to speak again going into the end of the week.
- USD/JPY may stage a larger recovery as the pair works its way back above former-support around 114.60 (23.6% expansion), but the downward trending channel carried over from December may keep the pair within a broad range amid the mixed price action across the global benchmark equity indices.
For More Updates, Join DailyFX Currency Analyst David Song for LIVE Analysis!
Click HERE for the Entire DailyFX Webinar schedule.

- The DailyFX Speculative Sentiment Index (SSI) shows the retail crowd have flipped net-short USD/JPY ahead of the last-full week of January, while trades remains net-short NZD/USD since January 12.
- USD/JPY SSI stands at -1.12 as 47% of traders are long, with long positions 17.3% lower from the previous week, while open interest is 2.0% below the monthly average
- NZD/USD SSI sits at -1.51 as 40% of traders are long, with long positions 14.7% lower from the previous week as open interest stands 8.8% below the monthly average.
- The flip in USD/JPY suggests the retail crowd is attempting to fade the recent rebound in USD/JPY especially as short-positions climbed 10.4% from the previous week, and the SSI may serve more as a contrarian indicator over the coming days should the ratio highlight a further shift in positioning and push deeper into negative territory.
Why and how do we use the SSI in trading? View our video and download the free indicator here

Click Here for the DailyFX Calendar
If you’re looking for trading ideas, check out our Trading Guides.
Read More:
COT-Crude Oil Positioning Remains Extreme
Crude Oil Price Forecast: Oil’s Impressive Polarity Zone Pivot
Silver Price Resistance and Dollar Support Confluence
USD/CAD at Risk for Further Losses Sub-1.33
--- Written by David Song, Currency Analyst
To contact David, e-mail dsong@dailyfx.com. Follow me on Twitter at @DavidJSong.
To be added to David's e-mail distribution list, please follow this link.


