


Talking Points:
- USD/CAD Continues to Carve Bearish Formation Ahead of Canada CPI.
- USD/JPY Topside Targets Remain in Focus as Bullish Momentum Gathers Pace.

| Currency | Last | High | Low | Daily Change (pip) | Daily Range (pip) |
|---|---|---|---|---|---|
| USD/CAD | 1.3447 | 1.3450 | 1.3400 | 1 | 50 |
USD/CAD Daily

Chart - Created Using Trading View
- USD/CAD stands at risk for a larger pullback as it continues to carve a near-term series of lower highs & lows, while the Relative Strength Index (RSI) comes up against trendline support; failure to preserve the bullish formation may ultimately push the dollar-loonie towards the lower bounds of the ascending channel formation especially as the oscillator reverses course ahead of overbought territory.
- Even though the Bank of Canada (BoC) keeps the door open to further embark on its easing-cycle, the recent recovery in crude oil prices accompanied by expectations for an uptick in Canada’s Consumer Price Index (CPI) may keep the loonie afloat over the coming days and encourage Governor Stephen Poloz and Co. to preserve the current policy for the foreseeable future especially as the central bank ‘expects total CPI inflation to be close to 2 percent from early 2017 onwards.’
- The near-term focus remains tilted to the downside following the failed attempt to test the Fibonacci overlap around 1.3630 (38.2% retracement) to 1.3660 (78.6% expansion), with the first region of interest coming in around 1.3460 (61.8% retracement) followed by 1.3300 (61.8% expansion) to 1.3310 (38.2% retracement).
| Currency | Last | High | Low | Daily Change (pip) | Daily Range (pip) |
|---|---|---|---|---|---|
| USD/JPY | 109.69 | 109.69 | 108.56 | 61 | 113 |
USD/JPY Daily
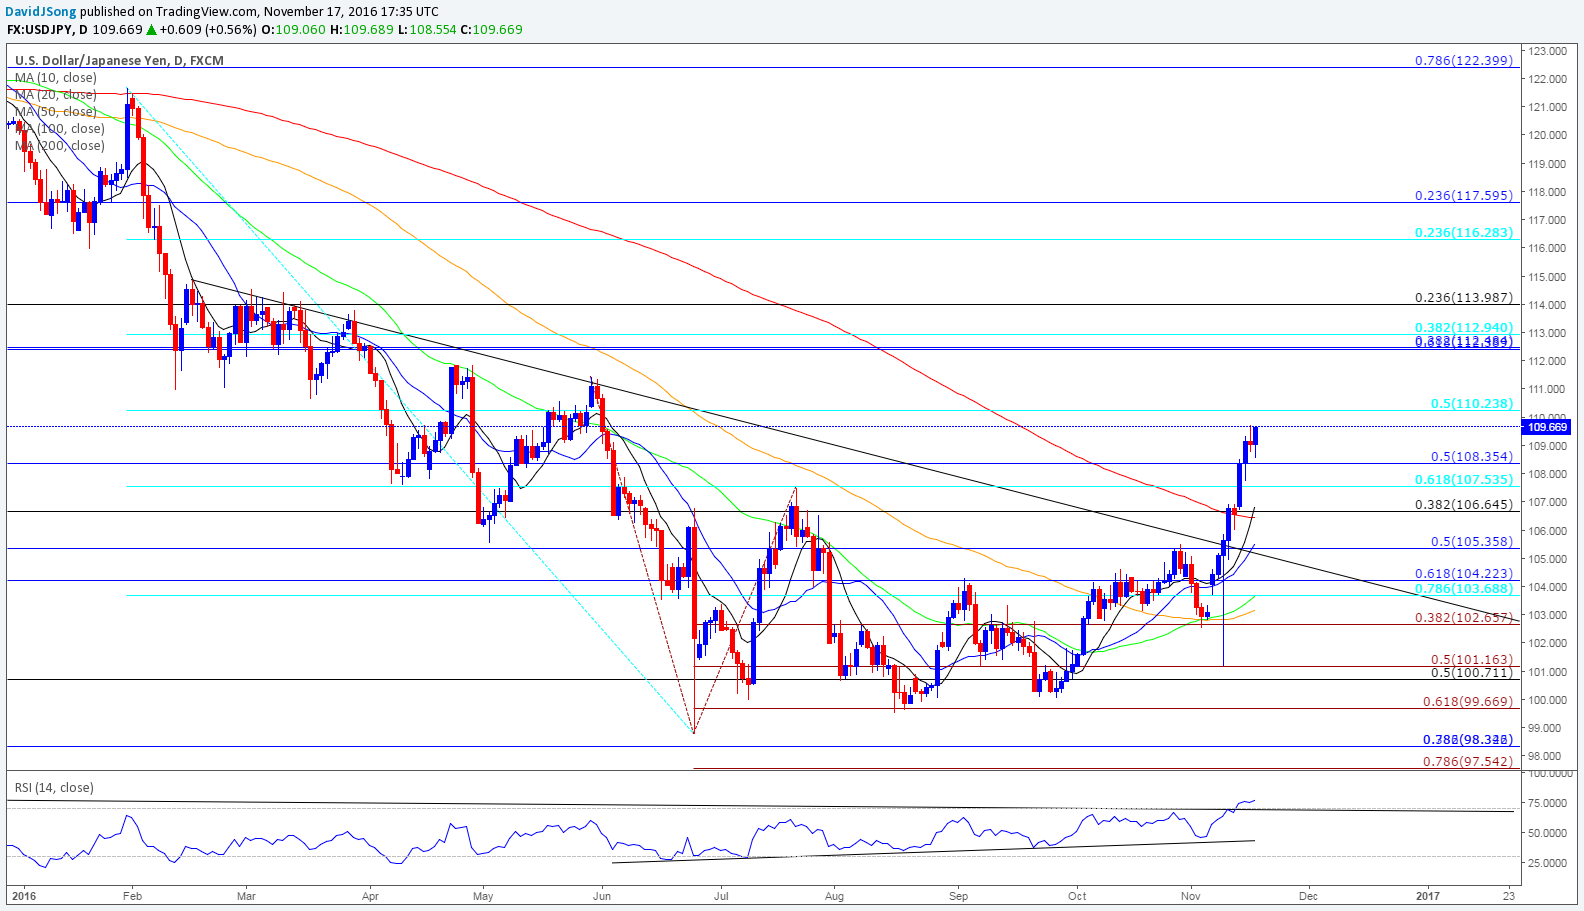
Chart - Created Using Trading View
- With the USD/JPY breakout highlighting a shift in market behavior, the exchange rate may continue to track higher over the remainder of the month especially as the RSI pushes deeper into overbought territory; need the oscillator to fall below 70 (textbook sell-signal) to suggest a near-term pullback is underway.
- The dollar-yen may continue to retrace the decline from earlier this year amid pickup in risk appetite paired with growing expectations for a December Fed rate-hike, but the fresh projection due out at the next quarterly meeting on December 14 may heavily impact the exchange rate as market attention turns to the 2017-rotation within the Federal Open Market Committee (FOMC), with Chicago Fed President Charles Evans, Philadelphia Fed President Patrick Harker, Dallas Fed President Robert Kaplan and Minneapolis Fed President Neel Kashkari joining the permanent-voting members.
- Broader outlook for USD/JPY is becoming increasingly constructive as price & RSI break out of the long-term bearish trends, with the next topside target coming in around 110.20 (50% retracement) followed by the May high (111.45).

- The DailyFX Speculative Sentiment Index (SSI) shows the retail crowd is net-short USD/JPY for the first time since July 20 after hitting a 2016-extreme of +6.04 in September, while traders have been net-short USD/CAD since October 20.
- USD/JPY SSI sits at -1.54 as 39% of traders are long, with short positions 43.6% higher from the previous week as open interest stands 13.2% above the monthly average.
- USD/CAD SSI sits at -1.26 as 44% of traders are long, with long positions 47.4% higher from the previous week, while open interest stands 5.9% above the monthly average.
- May see the USD/JPY SSI push deeper into negative territory on a further advance in exchange rate as the retail crowd tries to catch a near-term top.
Why and how do we use the SSI in trading? View our video and download the free indicator here

Click Here for the DailyFX Calendar
Get our top trading opportunities of 2016 HERE
Read More:
US Dollar Whiplash Ends with a Trump Bump
GBP/JPY Technical Analysis: New Trend in Play after 800-Pip, 3-Day Romp
USD/CAD Technical Analysis: Pending Trade Talks & U.S. Inflation Weakens CAD
S&P 500 - Bears Got Trumpled, Short-term Trading Levels Noted
--- Written by David Song, Currency Analyst
To contact David, e-mail dsong@dailyfx.com. Follow me on Twitter at @DavidJSong.
To be added to David's e-mail distribution list, please follow this link.


