


Talking Points:
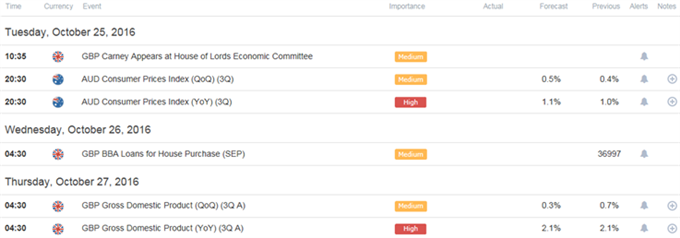
- AUD/USD Remains Range-Bound Ahead of Australia 3Q CPI; Sticky Inflation on Tap?
- GBP/USD Pares Losses as BoE Governor Mark Carney Stresses Price Stability Goal.
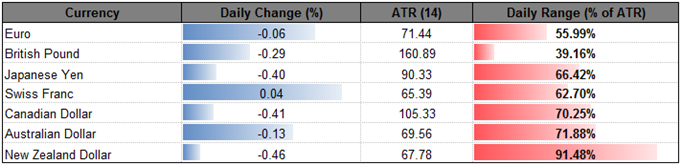
| Currency | Last | High | Low | Daily Change (pip) | Daily Range (pip) |
|---|---|---|---|---|---|
| AUD/USD | 0.7636 | 0.7648 | 0.7589 | 25 | 59 |
AUD/USD Daily
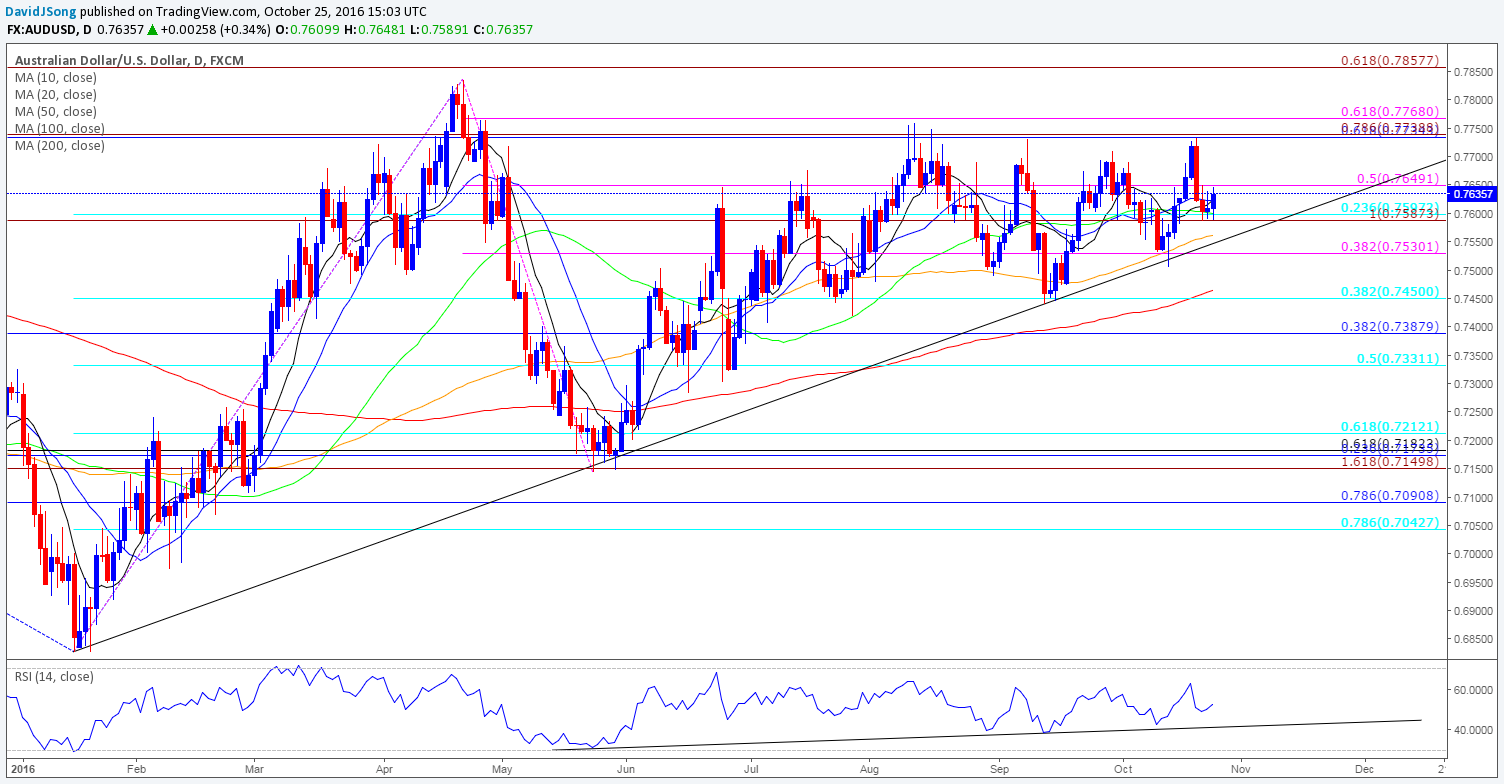
Chart - Created Using Trading View
- AUD/USD may make a more meaningful attempt to break out of the range-bound price action from earlier this week as Australia’s Consumer Price Index (CPI) is expected to uptick to an annualized 1.1% from 1.0% in the second-quarter, while the core rate of inflation is projected to hold steady at an annualized 1.7%; sticky price growth may boost the appeal of the Australian dollar, with ah break of 0.7650 (50% expansion) raising the risk for a move back towards 0.7730 (61.8% retracement) to 0.7740 (78.6% expansion).
- Sticky price growth may encourage the Reserve Bank of Australia (RBA) to preserve the current policy at the November 1 interest-rate decision, but signs of easing price pressures may prompt Governor Philip Lowe to further insulate the region especially as the global economy grows ‘at a lower than average pace’.
- Will keep a close eye on the topside targets for AUD/USD as largely preserves the ascending triangle formation from earlier this year, with a break/close above the Fibonacci overlap around 0.7730 (61.8% retracement) to 0.7770 (61.8% expansion) opening up the 2016-high (0.7835) along with the next topside region of interest around 0.7860 (61.8% expansion).
| Currency | Last | High | Low | Daily Change (pip) | Daily Range (pip) |
|---|---|---|---|---|---|
| GBP/USD | 1.2139 | 1.2244 | 1.2083 | 99 | 161 |
GBP/USD Daily
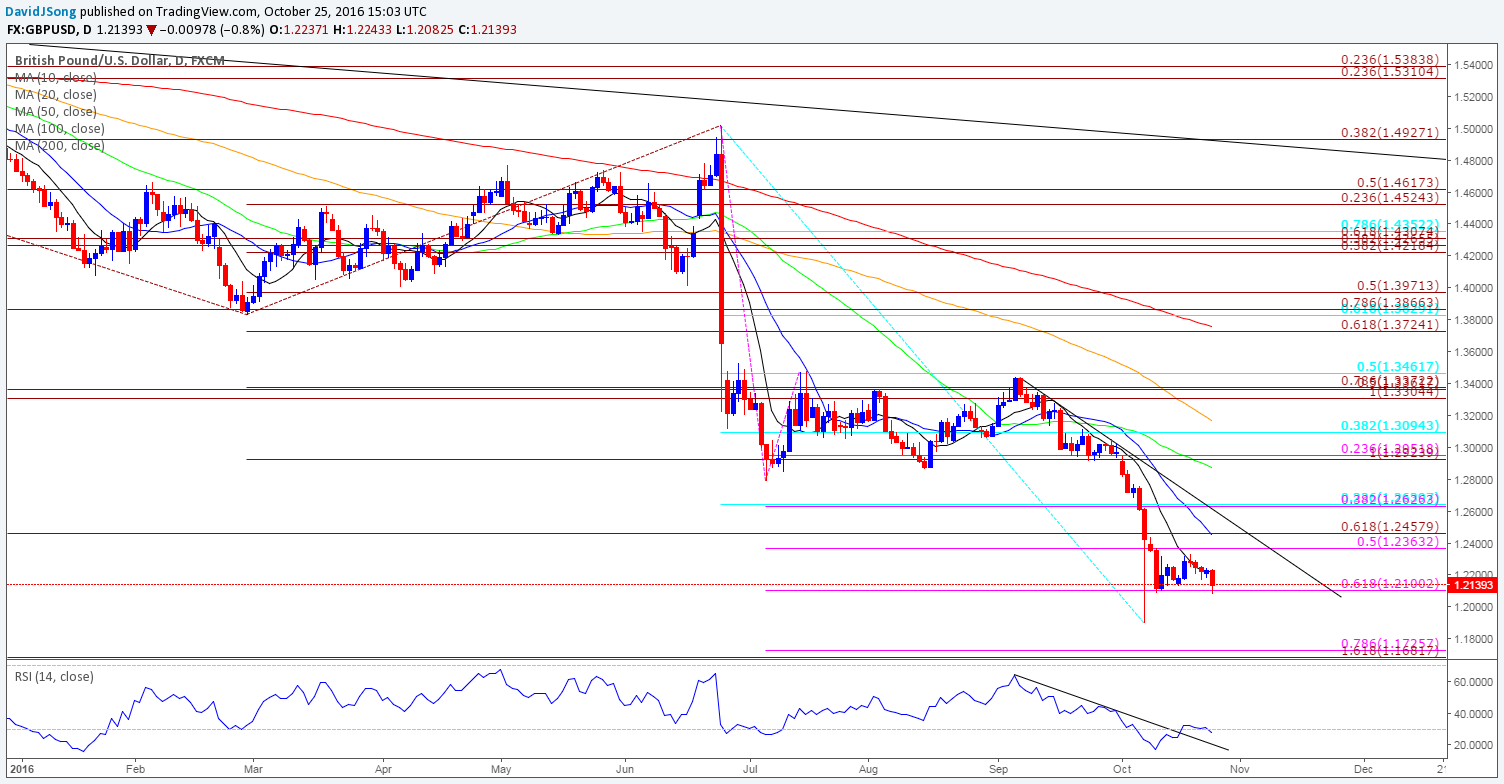
Chart - Created Using Trading View
- GBP/USD bounced back from a fresh weekly low of 1.2082 as Bank of England (BoE) Governor Mark Carney argued the central bank’s key role is to achieve price stability and warned of the limitations of monetary policy; the recent comments suggest the Monetary Policy Committee (MPC) will stick to the sidelines at the next ‘super Thursday’ event on November 3 as officials assert the next quarterly inflation report (QIR) will reflect the sharp decline in the exchange rate.
- The looming U.K. Gross Domestic Product (GDP) report may push the BoE to retain the current policy throughout the remainder of the year as the economy is projected to growth another annualized 2.1% in the third-quarter of 2016, and the central bank may carry its wait-and-see approach into 2017 as the BoE sees a greater risk of overshooting the 2% target for inflation amid the marked depreciation in the British Pound.
- Another failed attempt to close below 1.2100 (61.8% expansion) may continue to foster range-bound prices in GBP/USD, with the exchange rate largely capped by 1.2360 (50% expansion).
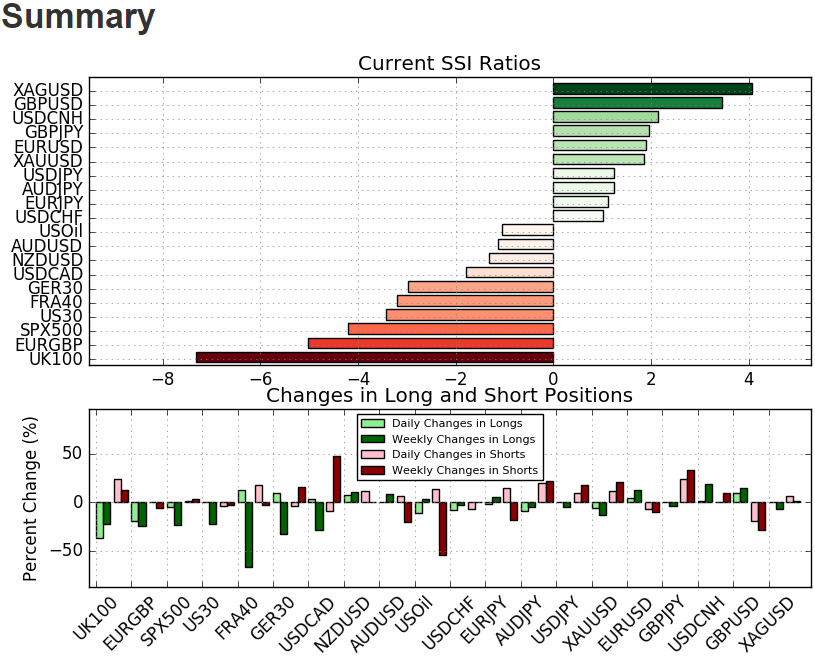
- The DailyFX Speculative Sentiment Index (SSI) shows the retail crowd remains net-long GBP/USD even after the British Pound ‘flash crash, with the ratio hitting an extreme reading of 5.97 earlier this month, while traders have been net-short AUD/USD since October 14.
- GBP/USD SSI currently sits at +3.42 as 77% of traders are long, with short positions 27.2% lower from the previous week as open interest stands 2.1% below the monthly average.
- AUD/USD SSI stands at -1.14 as 47% of traders are long, with short positions 16.4% lower from the previous week, while open interest stands 6.2% below the monthly average.
- Market participation may continue to narrow going into the end of the month especially with the slew of central bank meetings lined up for November.
Why and how do we use the SSI in trading? View our video and download the free indicator here
Click Here for the DailyFX Calendar
Get our top trading opportunities of 2016 HERE
Read More:
EUR/CAD Rebound or Reversal? Line-in-the-Stand at 1.4600
USD Breakout – Does it Have Room to Run?
Gold Price and Oil See Headwinds as USD Strongest Since February
Forex Technical Focus: Range Highs for Nikkei; USD/JPY Lags
--- Written by David Song, Currency Analyst
To contact David, e-mail dsong@dailyfx.com. Follow me on Twitter at @DavidJSong.
To be added to David's e-mail distribution list, please follow this link.


