


Talking Points:
- NZD/USD Bucks Comm. Bloc Weakness; Outlook Remains Mired by H&S Formation.
- USD/JPY Narrowing Range to Persist; Retail Sentiment Snaps Back From Fresh 2016 Extreme.
| Currency | Last | High | Low | Daily Change (pip) | Daily Range (pip) |
|---|---|---|---|---|---|
| NZD/USD | 0.7293 | 0.7303 | 0.7255 | 9 | 48 |
NZD/USD Daily

Chart - Created Using Trading View
- NZD/USD outperforms against its commodity bloc counterparts going into the last day of September, but the rebound may be short-lived as it holds within the previous day’s range, with the broader outlook turning increasingly bearish as a downward trend appears to be taking shape ahead of October; keeping a close eye on the Relative Strength Index (RSI) as it continues to come up against trendline support.
- Even though the Reserve Bank of New Zealand (RBNZ) remains inclined to further embark on its easing cycle, the broader outlook for NZD/USD remains constructive as it preserves the bullish pattern from earlier this year, and a move back above 0.7350 (61.8% expansion) would negate the risk for a head-and-shoulders reversal especially as the New Zealand dollar benefits from the low-yielding environment.
- Waiting for a break/close below 0.7200 (38.2% expansion) to 0.7210 (38.2% retracement) accompanied by a bearish RSI trigger to adopt a more bearish outlook for NZD/USD.
| Currency | Last | High | Low | Daily Change (pip) | Daily Range (pip) |
|---|---|---|---|---|---|
| USD/JPY | 101.39 | 101.84 | 100.66 | 70 | 118 |
USD/JPY Daily
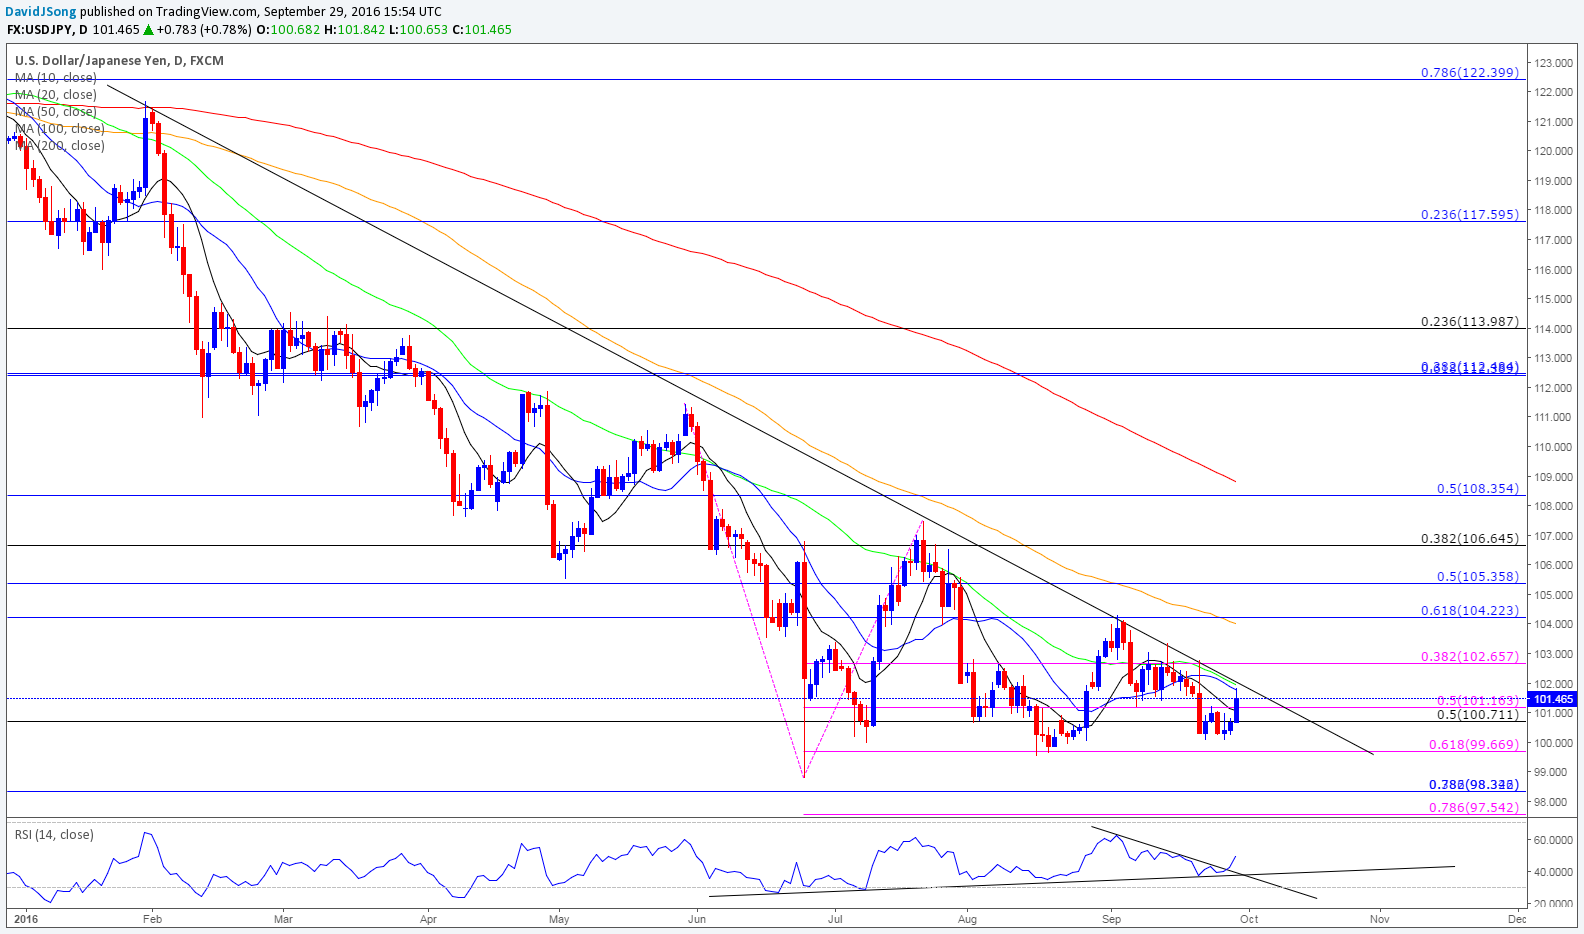
Chart - Created Using Trading View
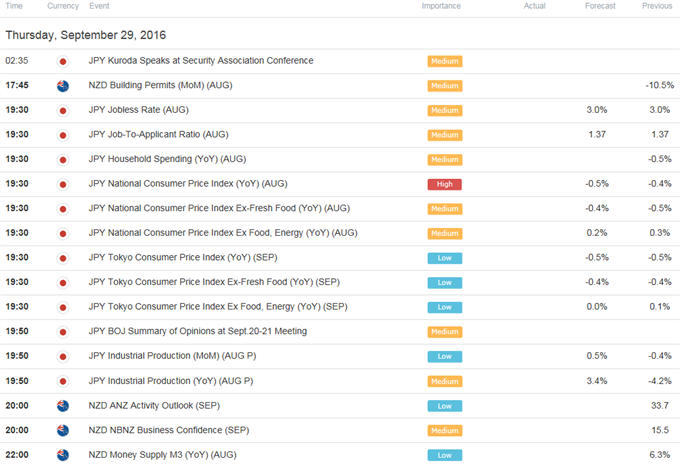
- USD/JPY may stage a larger advance as it breaks out of the narrow range from earlier this week, with the Relative Strength Index (RSI) largely following suit as it clears the bearish formation from earlier this month; will keep a close eye on the headlines over the next 24-hours of trade with Bank of Japan (BoJ) Meeting Minutes due out, while Governor Haruhiko Kuroda is scheduled to deliver a speech.
- The fresh batch of central bank rhetoric may dampen the appeal of the Japanese Yen as Governor Kuroda keeps the door open to further embark on its easing cycle, but the ‘qualitative and qualitative easing with yield-curve control’ may end up not having the intended impact as market participants see a risk of reduced BoJ purchases of Japanese Government Bonds (JGB).
- The short-term outlook for USD/JPY is becoming increasingly constructive as the pair attempts to stage a larger recovery, but the broader outlook remains tilted to the downside, with the dollar-yen at risk of resuming the downward trend from earlier this year as it appears to be stuck in a descending triangle formation.

- The DailyFX Speculative Sentiment Index (SSI) shows the FX crowd remains net-long USD/JPY since July 21, with the ratio hitting a fresh 2016 extreme this week as it climbed to +6.00, while traders remain net-short NZD/USD going into the end of the month.
- USD/JPY SSI has narrowed sharply and currently sits at +2.78 as 74% of traders are long, while short positions have jumped 46.5% from the previous week, with open interest 10.5% above the monthly average.
- NZD/USD SSI stands at -1.24 as 45% of traders are long, with long positions 6.6% higher from the previous week, while open interest is 2.8% below the monthly average.
- Will keep a close eye in NZD/USD SSI as it appears to be making a deeper push into oversold territory, but the narrowing in the USD/JPY ratio may highlight more sideways price action ahead as retail traders appear to be playing the near-term range in the exchange rate.
Why and how do we use the SSI in trading? View our video and download the free indicator here
Click Here for the DailyFX Calendar
Get our top trading opportunities of 2016 HERE
Read More:
S&P 500: Several Angles of Influence at Work Here
COT-Most Selling by AUD Speculators Since 2013
Fed Rhetoric to Keep USD Crosses in Focus Post-FOMC
GBP/AUD at Risk for Key Reversal Above 1.6977
--- Written by David Song, Currency Analyst
To contact David, e-mail dsong@dailyfx.com. Follow me on Twitter at @DavidJSong.
To be added to David's e-mail distribution list, please follow this link.


