


Talking Points:
- USD/CAD Eyes Topside Hurdles Following Dismal Canada GDP Report.
- USDOLLAR Strength Vulnerable to Dismal ISM Manufacturing Survey.
Avoid the pitfalls of trading by steering clear of classic mistakes. Review these principles in the "Traits of Successful Traders" series.

Chart - Created by David Song
- Despite the kneejerk reaction to the Canada’s weaker-than-expected 2Q Gross Domestic Product (GDP) report, USD/CAD climbs to a fresh weekly high, with the pair at risk of testing the August (1.3199) as well as the July high (1.3253) as the pair continues to carve a near-term series of higher highs & lows, while the Relative Strength Index (RSI) threatens the bearish formation carried over from earlier this year.
- Even though the Bank of Canada (BoC) endorses a wait-and-see approach for monetary policy and anticipates a strong economic rebound in the third-quarter, Governor Stephen Poloz may adopt a more dovish tone as the details of the GDP report shows the contraction was largely led by a 16.7% decline in exports of goods & services.
- Break/close above 1.3130 (38.2% retracement) to open up the next topside target at 1.3199 (August high) followed by 1.3253 (July high), with key resistance coming in around 1.3300 (50% retracement) to 1.3310 (38.2% retracement).
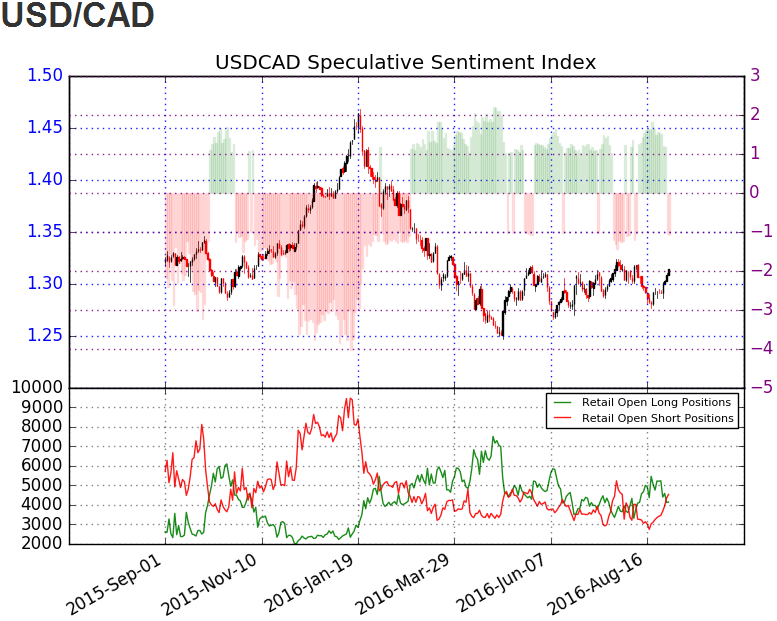
- The DailyFX Speculative Sentiment Index (SSI) shows the FX crowd has flipped net-short USD/CAD just ahead of September, with the ratio slipping into negative territory for the first time since August 8.
- The ratio currently sits at -1.06 as 48% of traders are long, with short positions 31% higher from the previous week, while open interest stands 8.1% above the monthly average. The shift in position suggests the retail crowd is looking for range-bound conditions in USD/CAD going into September.
Why and how do we use the SSI in trading? View our video and download the free indicator here
USDOLLAR(Ticker: USDollar):
| Index | Last | High | Low | Daily Change (%) | Daily Range (% of ATR) |
|---|---|---|---|---|---|
| US Dollar Index | 12019.87 | 12028 | 11995.89 | 0.08 | 63.83% |

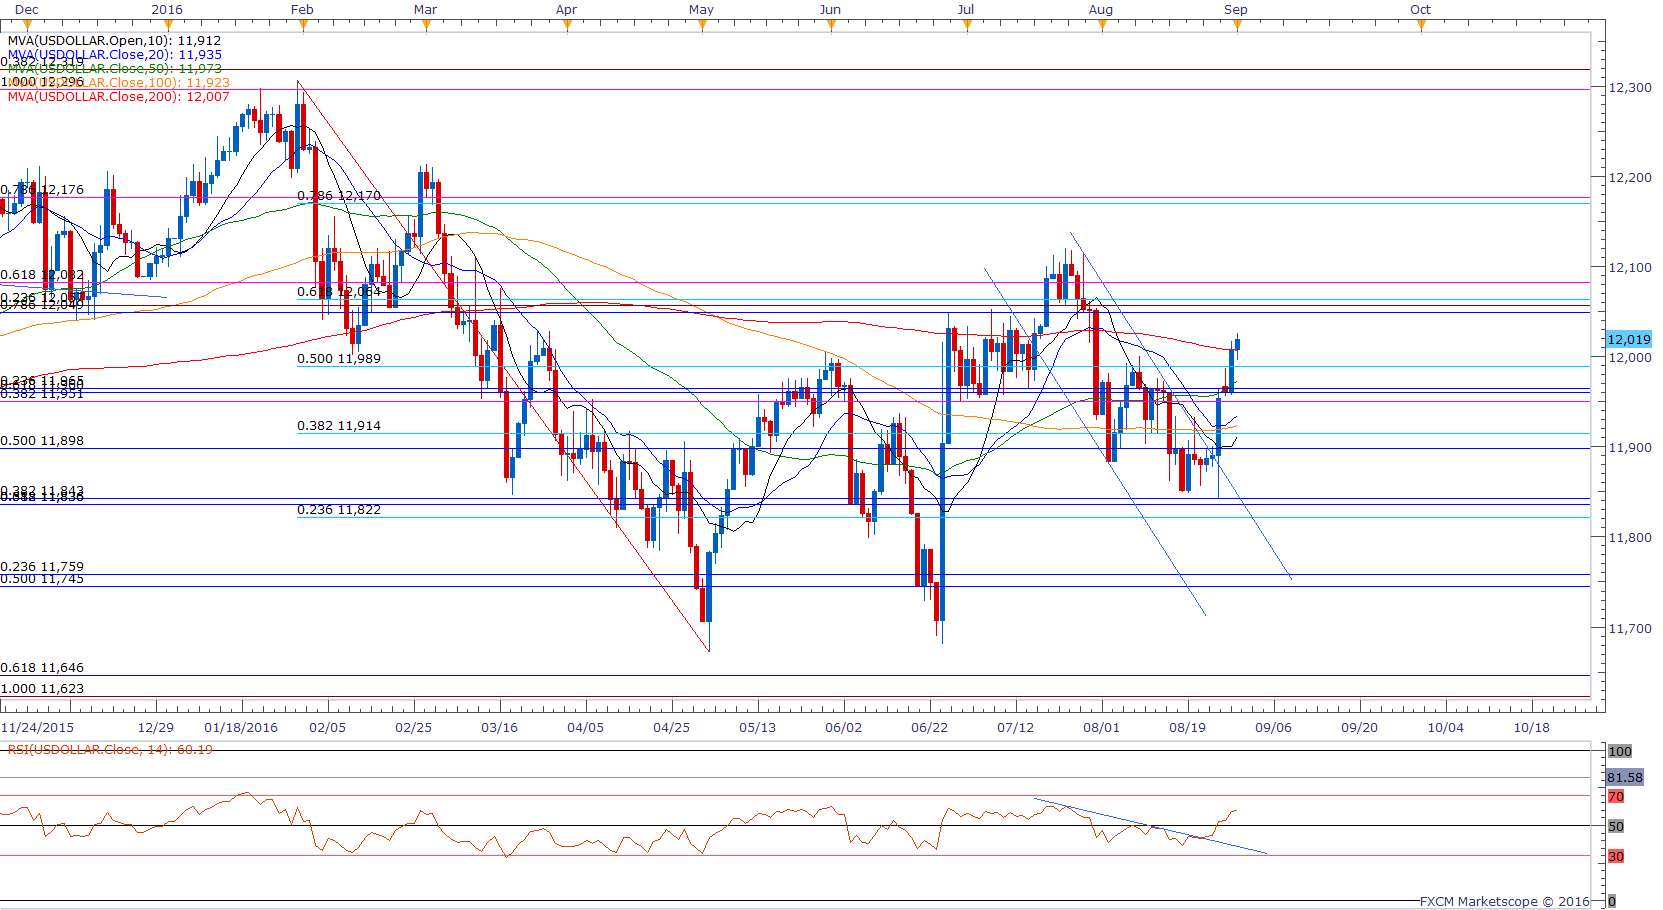
Chart - Created by David Song
- The USDOLLAR pushes to a fresh monthly high ahead of September, with the greenback at risk for a further advance as the 177K expansion in ADP Employment boosts expectations for a strong U.S. Non-Farm Payrolls (NFP) report; may see the greenback continue to benefit from the recent pickup in interest-rate expectations as Fed officials talk up bets for a 2016 rate-hike.
- However, a marked downtick in the ISM Manufacturing survey may impeded on the near-term appreciation as it dampens the outlook for growth and inflation, which may encourage the Federal Open Market Committee (FOMC) to retain the current policy in September especially as market participants price a 27% probability for a rate-hike next month.
- Will continue to watch the topside targets for the USDOLLAR, with the next hurdle coming in around 12,049 (78.6% retracement) to 12,064 (61.8% retracement), followed by 12,170 (78.6% retracement) 12,176 (78.6% expansion).

Click Here for the DailyFX Calendar
Get our top trading opportunities of 2016 HERE
Read More:
S&P 500: Yellen Sparks Volatility, Market Starts Week at Pivotal Area
USD/JPY Technical Analysis: Implied Vol Shows Trader’s Nerves
EUR/JPY Technical Analysis: Sticking to the Range
EURUSD: Waiting for the Dip & Rip- Key Resistance at 1.1400
--- Written by David Song, Currency Analyst
To contact David, e-mail dsong@dailyfx.com. Follow me on Twitter at @DavidJSong.
To be added to David's e-mail distribution list, please follow this link.


