


Talking Points:
- USD/CAD Holding Pattern at Risk on Strong Canada Employment Report.
- USDOLLAR Outlook Hinges on NFP Report as Interest-Rate Expectations Dwindle.
Avoid the pitfalls of trading by steering clear of classic mistakes. Review these principles in the "Traits of Successful Traders" series.

Chart - Created by David Song
- USD/CAD may consolidate ahead of the weekend as it remains stuck within a wedge/triangle formation, with the pair at a risk for a meaningful break as it approaches the apex; long-term outlook remains tilted to the downside as price & the Relative Strength Index (RSI) preserve the downward trend from earlier this year.
- With Canada Employment expected to increase another 5.0K in June, a further improvement in the labor market may heighten the appeal of the loonie as it raises the Bank of Canada’s (BoC) scope to gradually move away from its easing cycle.
- Will keep a close eye on the downside targets as USD/CAD largely consolidates within a continuation pattern, with a break of the July low (1.2830) raising the risk for a move back towards near-term support around 1.2620 (50% retracement) to 1.2650 (50% retracement).

- The DailyFX Speculative Sentiment Index (SSI) shows the retail crowd remains net-long USD/CAD since June 28, with the ratio hitting an extreme back in April at it climbed to +2.25.
- The ratio currently sits at +1.05 as 51% of traders are long, with long positions 8.5% lower from the previous week as open interest stands 7.5% below the monthly average.
Why and how do we use the SSI in trading? View our video and download the free indicator here
USDOLLAR(Ticker: USDollar):
| Index | Last | High | Low | Daily Change (%) | Daily Range (% of ATR) |
|---|---|---|---|---|---|
| US Dollar Index | 12011.38 | 12017.65 | 11984.91 | 0.03 | 45.23% |

Chart - Created by David Song
- Despite the 172K expansion in ADP Employment, the limited market reaction may keep the USDOLLAR within a narrow range as market attention turns to the highly anticipated U.S. Non-Farm Payrolls (NFP) report, which is expected to show a 180K expansion in June.
- Even though Fed Funds Futures still show limited expectations for a 2016 Fed rate-hike, a material pickup in job growth may put increased pressure on the Federal Open Market Committee (FOMC) to raise the benchmark interest rate sooner rather than later as the economy approaches ‘full-employment.’
- Waiting for break of the near-term range as the USDOLLAR remains capped by the Fibonacci overlap around 12,049 (78.6% retracement) to 12,064 (61.8% retracement) with near-term support coming in around 11,951 (38.2% expansion) to 11,965 (23.6% retracement).
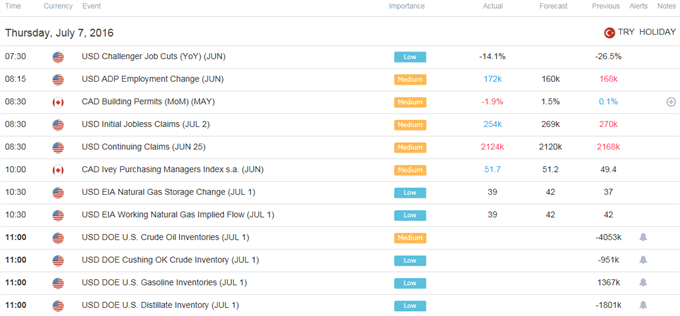
Click Here for the DailyFX Calendar
Get our top trading opportunities of 2016 HERE
Read More:
Technical Focus: Copper Base Still a Work in Progress
Silver Prices: Spiral Higher Triggers Historical Momentum Readings
USD/CAD Technical Analysis: Looking Ready To Claw-Back H1 Losses
USD/JPY Technical Analysis: The Proverbial Falling Knife
--- Written by David Song, Currency Analyst
To contact David, e-mail dsong@dailyfx.com. Follow me on Twitter at @DavidJSong.
To be added to David's e-mail distribution list, please follow this link.


