Fundamental Forecast for the US Dollar: Neutral
- Fed Chair Powell may need to deploy an aggressive tone this week to help the US Dollar as a 75-bps rate hike is fully discounted, and markets are pricing in an outside shot at a 100-bps rate hike.
- A deeper inversion of the US Treasury yield curve plus a rally to fresh yearly highs by US real rates are underlying US Dollar strength in the near-term.
- According to the IG Client Sentiment Index, the US Dollar has a bullish bias heading into the second half of September.
US Dollar Week in Review
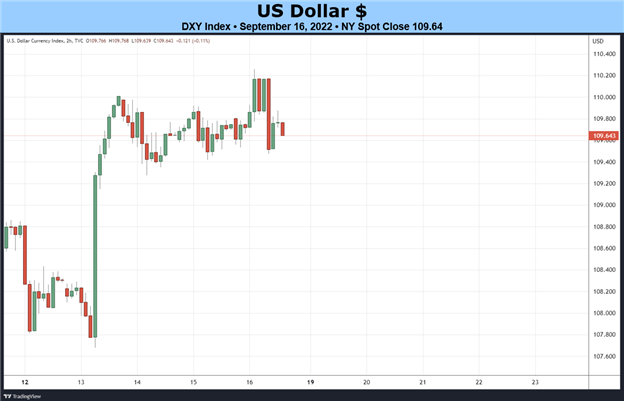
The US Dollar (via the DXY Index) warded off a failed bullish breakout last week, posting a +0.61% gain in the wake of the August US inflation report (CPI). Stubbornly high US inflation rates had financial markets reconsidering the near-term path of Fed rate hikes, translating into higher US real yields and a mid-week surge by the greenback. The largest component of the DXY Index, EUR/USD rates, fell by -0.31%. USD/JPY rates, the second largest component, added +0.19%. The most significant mover were GBP/USD rates, dropping by -1.46%.

Only One Item Matters on the Calendar
All things considered, it is a fairly light week on the US economic calendar. But the limited schedule of releases will be punctuated by the September Federal Reserve rate decision, far and away the most important item on the calendar among any major currency over the coming days. It may be the case that, but for FOMC, the US economic calendar barely goes noticed in the next week.
- On Monday, September 19, the September US NAHB housing market index will be released at 14 GMT.
- On Tuesday, September 20, August US building permits and housing starts are scheduled for publication at 12:30 GMT.
- On Wednesday, September 21, weekly US mortgage application figures are due at 11 GMT. August US existing home sales data will come out at 14 GMT. The September Federal Reserve rate decision will be announced at 18 GMT, alongside the release of the quarterly Summary of Economic Projections (SEP). Fed Chair Jerome Powell will host a press conference at 18:30 GMT.
- On Thursday, September 22, weekly US jobless claims data will be published at 12:30 GMT. The August US Conference Board leading index is due at 14 GMT.
- On Friday, September 23, Fed Chair Powell will give remarks at 18 GMT.

Atlanta Fed GDPNow 3Q’22 Growth Estimate (September 15, 2022) (Chart 1)
Based on the data received thus far about 3Q’22, the Atlanta Fed GDPNow growth forecast is now at +0.5% annualized. The downgrade was a result of “decreases in the nowcasts of third-quarter real personal consumption expenditures growth and third-quarter real gross private domestic investment growth from +1.7% and -6.1%, respectively, to +0.4% and -6.4%, respectively, [which were] slightly offset by an increase in the nowcast of third-quarter real government spending growth from +1.3% to +2.0%.”
For full US economic data forecasts, view the DailyFX economic calendar.
Rate Hike Odds Surge
We can measure whether a Fed rate hike is being priced-in using Eurodollar contracts by examining the difference in borrowing costs for commercial banks over a specific time horizon in the future. Chart 1 below showcases the difference in borrowing costs – the spread – for the front month/September 2022 and December 2022 contracts, in order to gauge where interest rates are headed by the end of this year.
Eurodollar Futures Contract Spread (September 2022-December 2022) [BLUE], US 2s5s10s Butterfly [ORANGE], DXY Index [RED]: Daily Timeframe (September 2021 to September 2022) (Chart 1)
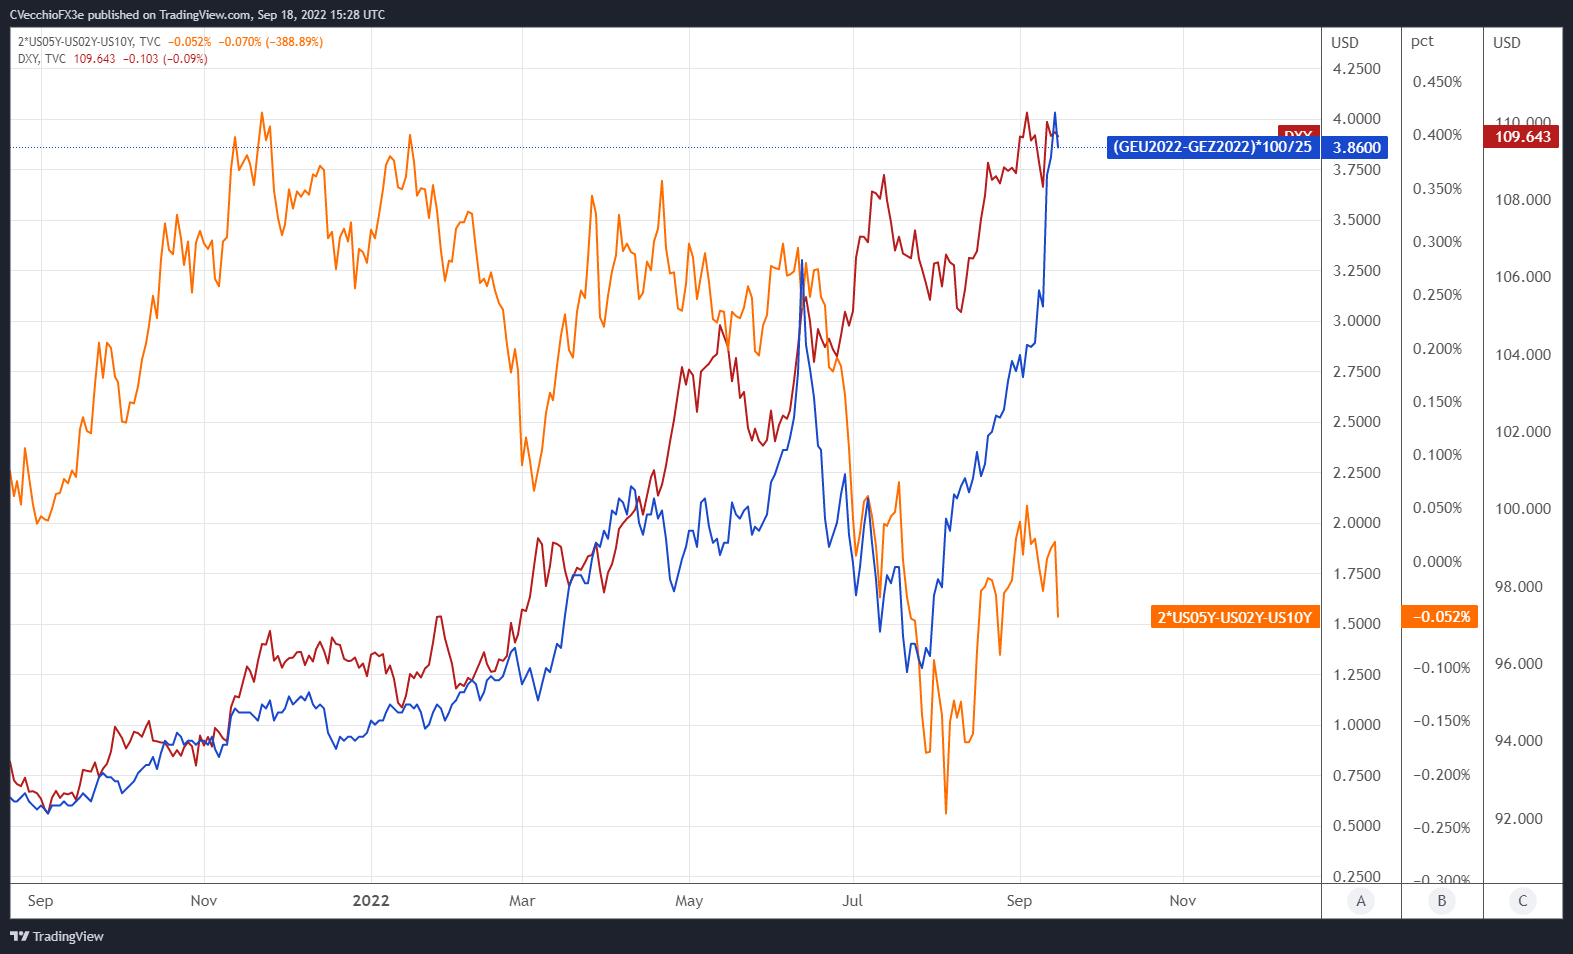
September thus far has been defined by rapidly rising Fed rate hike odds. On August 1, there was one 25-bps rate hike priced-in through the end of 2022, with a 34% chance of a second 25-bps rate hike (50-bps in total by the end of the year). Now, 75-bps worth of rate hikes are fully discounted, with a 44% chance of a fourth 25-bps rate hike.
To an extent, the market is suggesting that the last few Fed rate hikes may materialize in the coming months – with the bulk of the tightening efforts arriving this week, where a 75-bps rate hike is the base case scenario. Given the outside chance of a 100-bps rate hike, should the Fed deliver 75-bps and not offer hawkish forward guidance, the September Fed meeting could shape up to be a ‘buy the rumor, sell the news’ event for the US Dollar.
US Treasury Yield Curve (1-year to 30-years) (September 2020 to September 2022) (Chart 3)

The shape of the US Treasury yield curve – increasingly inverted relative to the start of the month – alongside rising Fed rate hike odds is proving a tailwind for the US Dollar. US real rates (nominal less inflation expectations) have reached fresh yearly highs, reinforcing the rally. Rejuvenated Fed rate hike expectations are underlying organic strength for the US Dollar, even though much of the recent rally is due to perceived problems abroad, particularly for the British Pound and the Euro.
CFTC COT US Dollar Futures Positioning (September 2020 to September 2022) (Chart 4)

Finally, looking at positioning, according to the CFTC’s COT for the week ended September 13, speculators slightly decreased their net-long US Dollar positions to 35,685 contracts from 36,146 contracts. The lack of a significant rise in net-long positioning comes as somewhat of a surprise, considering the reporting period ended after the release of the August US inflation report. Overall, US Dollar positioning remains near its most net-long levels in over five years, lending to the notion that the long US Dollar trade is still overcrowded.
Trade Smarter - Sign up for the DailyFX Newsletter
Receive timely and compelling market commentary from the DailyFX team
--- Written by Christopher Vecchio, CFA, Senior Strategist